Introduction
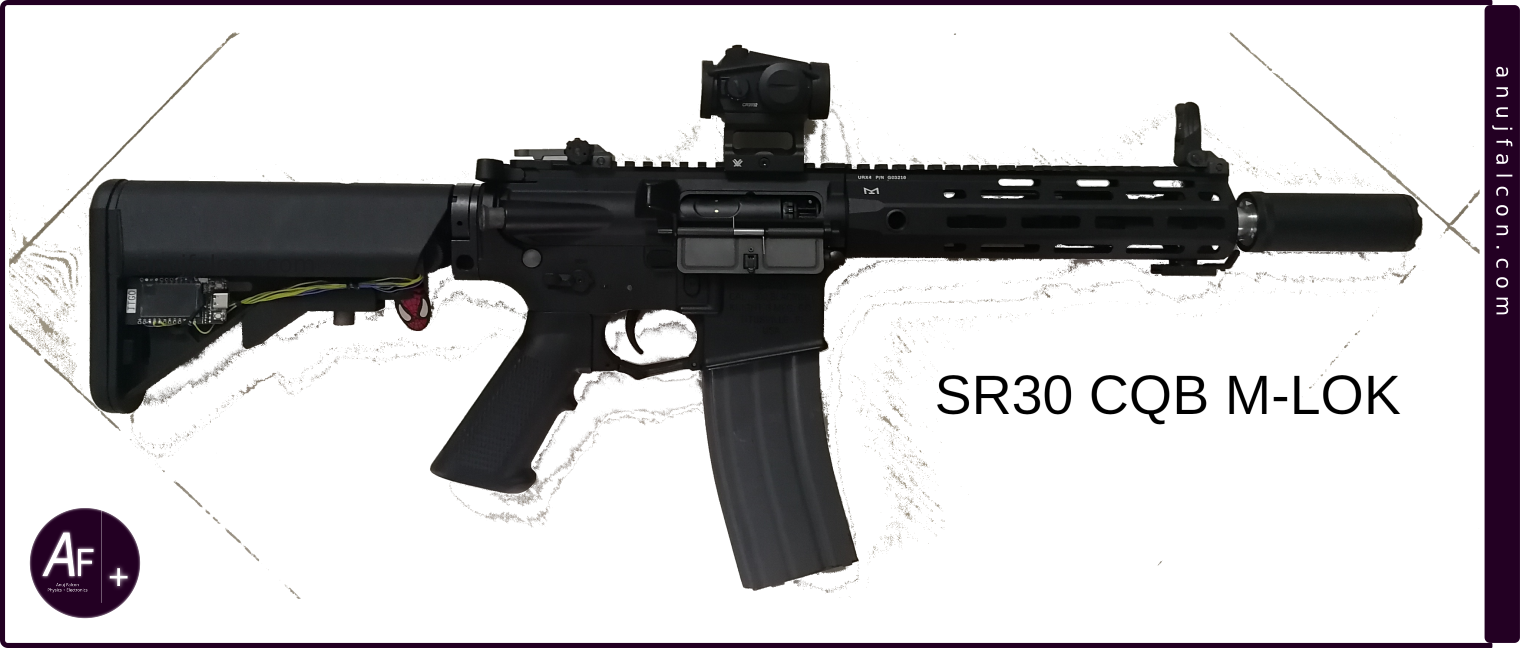
Automatic electric guns (AEG) are imitation toy airsoft guns used by children and adults to play in airsoft game events and for target practice. AEG’s are battery operated. They are relatively harmless when compared to a real gun. Nonetheless, they should always be treated like a real gun due to their appearance and also due to the energy their bullets contain, which can cause serious injuries including loss of eyesight. Hence it is very important to wear proper goggles at the least to protect the eyes before playing or experimenting with them. I use goggles like uvex apache [13] that have passed military standards (STANAG 2920/4296) as one’s eyesight is precious! Also protect other parts of the body like face, head and visible skin with required protective gear. I have heard stories of teeth getting knocked out during games as they shoot spherical plastic ballistic bullets (BB) with 6 mm diameter of various masses such as 0.2 g, 0.25 g, etc. I predominantly prefer biodegradable BBs as they can be left on the field without worrying about the environment. It is also important to realize that airguns are different from airsoft guns and they are way more dangerous than a typical airsoft gun. With those warnings in mind, I began experimenting with a beautiful piece of AEG equipment shown in Figure 1 named SR30 CQB from G&G [1]. I also managed to enjoy this gun in an indoor airsoft field, which is an abandoned power station at Antwerp, Belgium. Games were conducted in sessions and each session lasted for several minutes. As I am a PC gamer who prefers one shot one kill, I decided to follow a similar strategy in the field. After a few sessions and a few friendly fires, I finally got comfortable with the game. Due to the nature of my playstyle, I rarely exhausted my BBs. Sometimes I wanted to continue without refilling my magazines.
That’s when I faced a problem. After a session or during a session, it was almost impossible to know the exact count of BBs in the magazine, let alone track them across sessions. One way to solve this problem is to have multiple magazines and change them when in doubt. But if a magazine is pulled out of a gun before it’s empty, depending on the make and model of the magazine and the AEG, few fresh BBs get loose and fall on the ground only to be soiled and never to see the inside of the magazine again. Even though it might sound childish, I still didn’t want to waste those BBs. As shown in Figure 4, the default magazine also came with a follower to make sure even the last BB is fed properly. So I often find myself emptying the magazine after each session by firing the AEG in the indoor range, which for the first time felt great as a target practice but can get irritating sometimes as there weren’t a lot of other good options around to not waste the BBs. Another problem is that sometimes the last BB(s) can get stuck in the gun chamber (hop up unit) even when the magazine is empty or removed. Hence the gun will remain loaded and that’s dangerous! It’s much more dangerous in the gun I have as it contains a magazine empty detection mechanism that prevents firing the gun when the magazine is empty, giving the impression that there are no more bullets inside, while the reality can be just the opposite.
Besides, this empty/non-empty mechanism only works with the specially designed magazines that came with this particular AEG. When using magazines developed by third party vendors, the above problem could be less severe but one can be easily fooled for a magazine being non-empty as these third party magazines do not trigger the magazine empty detection mechanism. So one might find themselves firing an empty gun, which might only be detected by the vibration and sound the AEG generates while firing it, which is a deal breaker in a one shot one kill scenario. So I decided to solve these issues using a data acquisition system (DAQ). A full magazine can only contain a certain amount of BBs. For instance, the default magazine that came with my AEG can support a maximum of 90 BBs.
Understanding the AEG
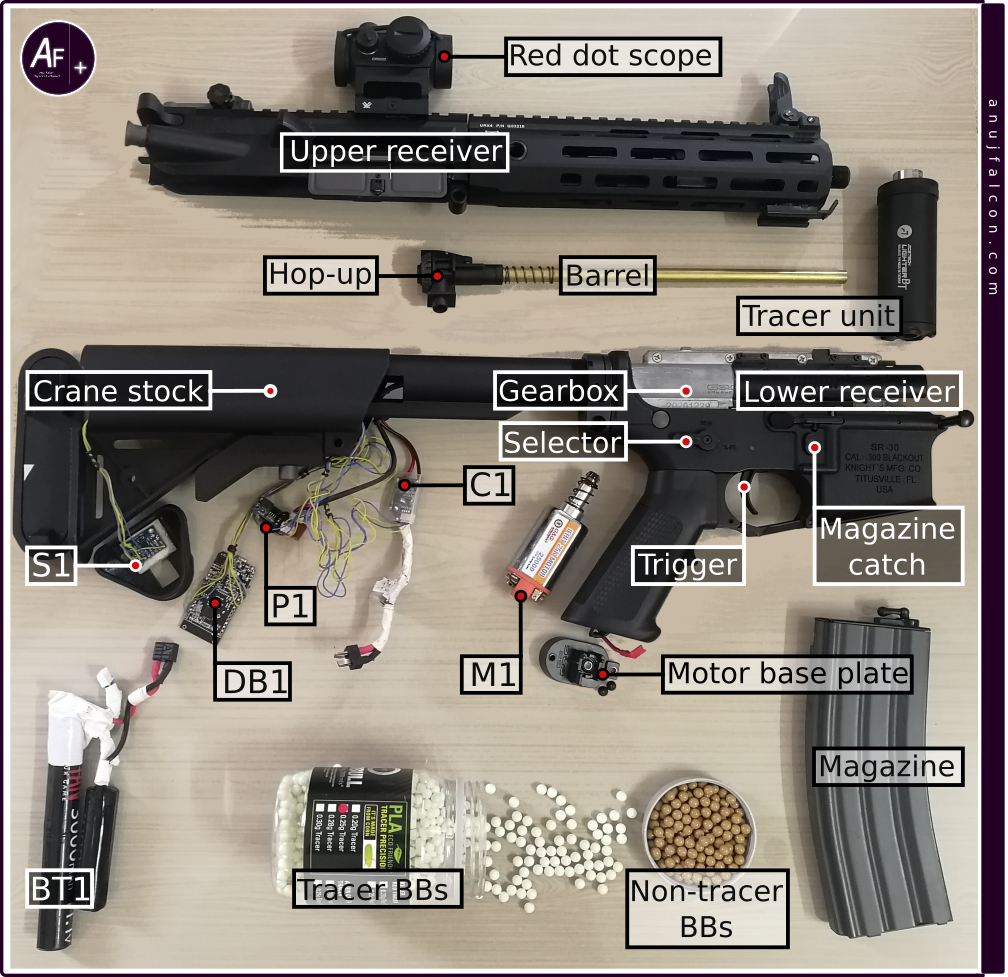
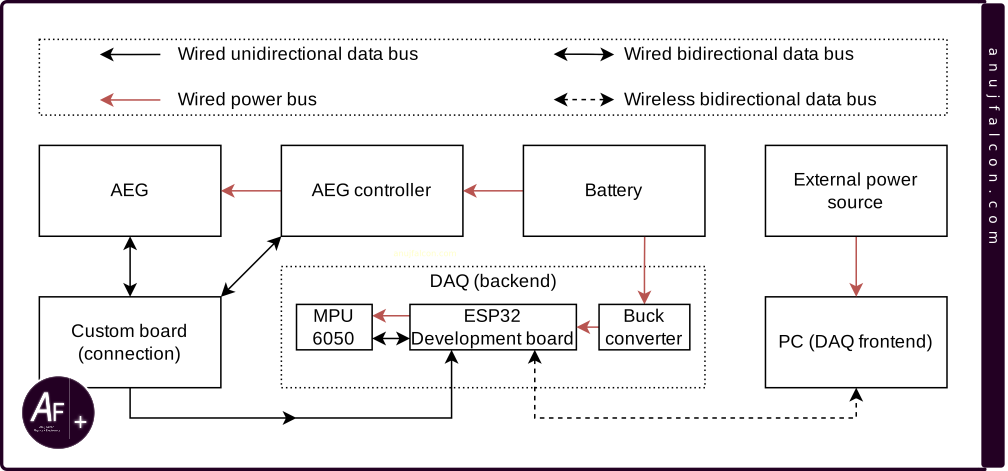
It is important to understand the different parts of AEG to better understand the electrical and non-electrical parameters obtained from it. The entire assembled AEG [1] is shown in Figure 1. Partially disassembled AEG along with the BBs is shown in Figure 2. AEG unloads a BB using an air piston operated by a spring. Let’s call it the ‘main spring’. A gearbox is used to pull the spring and let it loose. A DC motor (M1) located inside the gun’s grip is responsible for powering the gearbox. A crane stock / butterfly type rechargeable battery (BT1) that has a capacity of 3000 mAh operating at 11.1 V is responsible for powering the DC motor and detection mechanisms like the trigger detection inside the AEG through a control unit (AEG controller i.e. C1), colloquially called the ‘MOSFET’ even though the control unit contains additional electronic components. The block diagram of the entire electrical system in the unmodified AEG (used in this article) is shown in Figure 3.

The main spring in airsoft
The main spring responsible for generating the compressed air is located within the gearbox. Though the spring is located inside, the gearbox containing it is annotated in the center of Figure 2. The springs used in the AEG guns are marked by numbers prefixed with the letter(s) \(M\) or \(SP\). For example, \(M125\) spring is designed to push a \(6 mm\), \(0.2 g\) BB at the velocity of \( 125 \frac{m}{s} \). It’s a neat little standard followed within the airsoft community. Sometimes the airsoft field rules dictate that only AEGs that shoot BBs below certain joules will be allowed. If one knows the markings of the spring, it is easy to calculate the approximate kinetic energy. For instance, the approximate kinetic energy expected from a \(M125\) spring is \( 0.0002 kg \times \left( 125 \frac{m}{s} \right)^2 \times 0.5 \approx 1.56 J \). In other cases, the airsoft field rules would limit the velocity of the BBs to below a certain value rather than specifying the Joule count. If one uses a \(M125\) spring for a shooting \(0.2 g\) BB, the approximate velocity expected is \( 125 \frac{m}{s} \). However, if one uses a \(0.25 g\) BB with M125 spring, assuming the kinetic energy remains the same, the approximate velocity \(V\) is calculated as follows:
$$ 0.0002 Kg \times \left( V \frac{m}{s} \right)^2 \times 0.5 \approx 1.56 J$$
$$ V = \sqrt{\frac{1.56}{0.5 \times 0.00025}} \frac{m}{s}$$
$$ V \approx 112 \frac{m}{s}$$

Here \(m\) is meter, \(s\) is second, \(k\) is kilo, \(g\) is gram and \(J\) is Joule. The reason why I use the words ‘approximate kinetic energy / velocity expected’ rather than just ‘kinetic energy / velocity’ is to account for the losses or gains in energy / velocity due to reasons such as frictions, errors in the spring design, difference in gearbox and compression, etc. Not all springs maintain their kinetic energy. Certain springs maintain the same velocity even when the BBs weight changes, causing the Joules to increase as the mass of the BB increases. This is called Joulecreep. We won’t be dealing with it in this article. One of the easiest ways for airsoft field marshals to ensure AEG compliance is by using a chronograph. Shown in top-right of Figure 2 is a tracer unit that contains a chronograph within. This model is named as ACETECH Lighter BT (flat black) [21] and this equipment is commonly known as a ‘tracer unit’. It looks like a silencer but it is able to measure the energy of a BB indirectly by directly measuring the velocity of the BB, which can be monitored using the mobile application (App). User needs to input the weight of the BB for the App to calculate the BB’s energy. The tracer unit’s primary function is to illuminate special BBs that contain luminescent materials, making them glow in the dark and allows the user to trace its path while shooting, hence the name tracer unit. It is useful in low light conditions to detect and adjust the aim based on previous shots and confirm gameplay kills. The chronograph used by field marshals are usually standalone in nature, placed on a table or other stable surface, through which a BB whose velocity to be measured is fired.
In order to be compliant, some users will buy multiple springs with different ratings. However changing them usually requires disassembling the AEG followed by disassembling the gearbox. The AEG used in this project was advertised to contain a quick change spring system, which generally requires neither the AEG nor the gearbox within to be disassembled. While true quick change spring systems do exist, the reality of the one used in this project is that it still requires disassembling the AEG (but not the gearbox) which is not very practical in the field.
Magazine non-empty detection switch operation
The operation of the magazine non-empty detection switch is shown in Figure 4. When the magazine contains BBs, a small plastic piece protrudes (magazine switch presser) and keeps the magazine non-empty detection switch (SW2) closed, which is shown in Figure 5. But when the magazine is empty and the follower is out, the plastic piece (magazine switch presser) goes back to its normal position, leaving the magazine non-empty detection switch (SW2) open. As shown in Figure 5, the magazine non-empty detection switch (SW2) is kinda attached in series to the trigger so no matter how many times or for how long the trigger is pressed, the trigger signal is not going to change or be detected by the AEG controller when the magazine is empty.
AEG controller
The AEG controller marked ‘C1’ is shown in the center of Figure 2. The electrical system’s schematics of the unmodified AEG (with its AEG controller) is shown in Figure 5. The controller found in the AEG has a total of 8 wires/connections going out from it (i.e. the GC1, GC2 and GC3). Two of them are connected to the battery through deans / T plug connector (GC2). Another two of them get connected to the DC motor through the sliding connectors GC3. Remaining three out of four connections (GC1) are used to carry signals such as gearbox cycle, trigger and selector. And the final one connects to the ground. All the signals are connected to the pull up resistor by default. Trigger and selector signals are directly controlled by the user through the standard M4/M4A1 style AEG interface, which mechanically activates the electrical push buttons/switches (i.e. the SW1 and SW4 respectively). However, the signal for the gearbox cycle is generated by a limit switch located within the gearbox (SW3). A passive electrical fuse F1 exists to cut-off the battery from the rest of the system in case of overcurrent and prevents further damage to the battery or rest of the system.
When the trigger is pressed, it activates the SW1 and closes the circuit within its control. The trigger in this specific gun is connected serially to a magazine non-empty detection switch (SW2). When the magazine non-empty detection switch is pressed, it means that the magazine contains BBs and the trigger press will create a low logic at the trigger input of the AEG controller as the serial connection is closed (i.e. SW1 and SW2 are closed, connecting the trigger signal to the ground ). This change in logic level is detected by the AEG controller, which then activates the mechanical mechanisms (DC motor) to fire BB(s), depending on the selector signal.
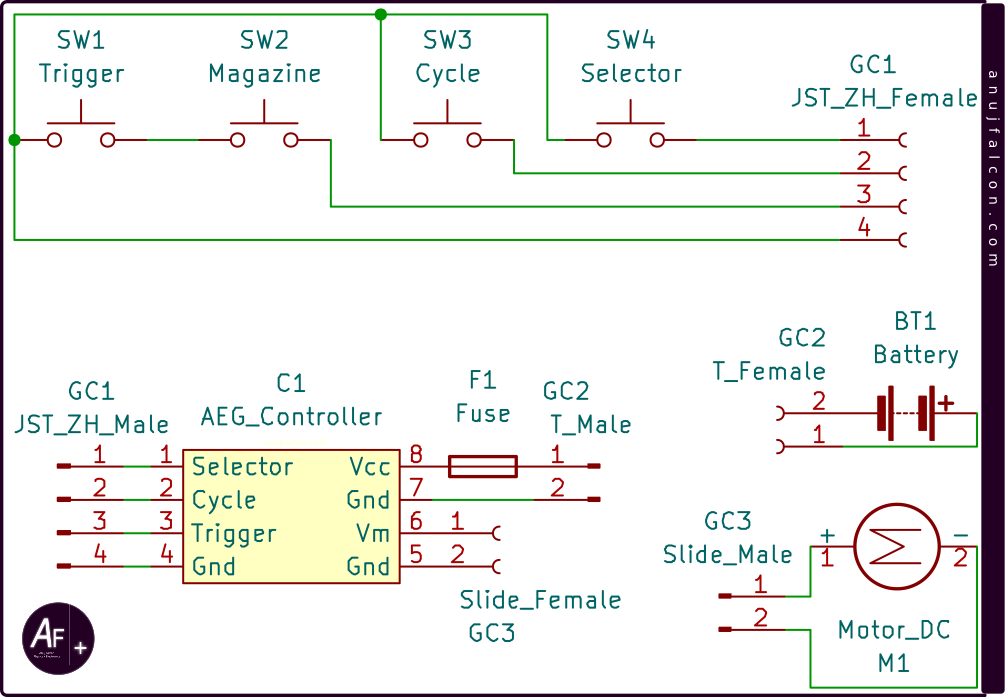
However, when the magazine non-empty detection switch is released, the serial connection is open and no matter how many times the trigger is pressed, the trigger input to the AEG controller won’t go low and the AEG won’t fire. Still, care must be taken as this does not mean that the gun is unloaded as a BB can still be inside the gun chamber (hop-up unit), waiting to be fired even without a magazine. The selector signal is responsible for selecting the mode of fire, which includes ‘safe’, ‘semi’ and ‘auto’. When the mode of fire is changed to ‘auto’, the switch SW4 is pressed and the selector signal connects to the ground, thus creating a low level logic in the selector input to the AEG controller. Otherwise the switch SW4 stays open and would cause the selector input to remain in high level both in ‘safe’ and ‘semi’ mode. Even though the ‘safe’ and ‘semi’ firing modes are indistinguishable from the selector input to the AEG controller electrically, there are mechanical differences. When the selector is in ‘safe’ firing mode, a physical obstruction is introduced which prevents the user from squeezing the trigger. Which means, a trigger can only be mechanically pressed in ‘semi’ or ‘auto’ firing mode. If a trigger is pressed when the selector is in ‘semi’/’safe’ firing mode, then the AEG will detect those signals and will activate the mechanical mechanisms to eject only one BB. However, if the selector is in ‘auto’ firing mode, then multiple BBs are ejected, until either the magazine is empty or the battery runs out of its stored energy.. The cycle input signal to the AEG controller is an indicator of the state of the gearbox. The stable state of this input signal is high logic level. A gear box is said to have completed one ‘gearbox cycle’ when it compresses and releases the main spring once. When the gears inside the gearbox are rotating, causing compression and release of the main spring, the limit switch SW3 is toggled, causing the cycle input signal to change its logic states in the following manner: high, low, high. This transition occurs for each gearbox cycle. However this transition is not clean due to bouncing of limit switch SW3. Whenever the SW3 gets pressed, the cycle input signal is connected to the ground, thus changing its logic level to low. 4 pole JST ZH 1.5 mm connectors (GC1) are used to connect these signals and the electrical ground between the AEG control unit and the switches within the AEG.
Hop-Up unit
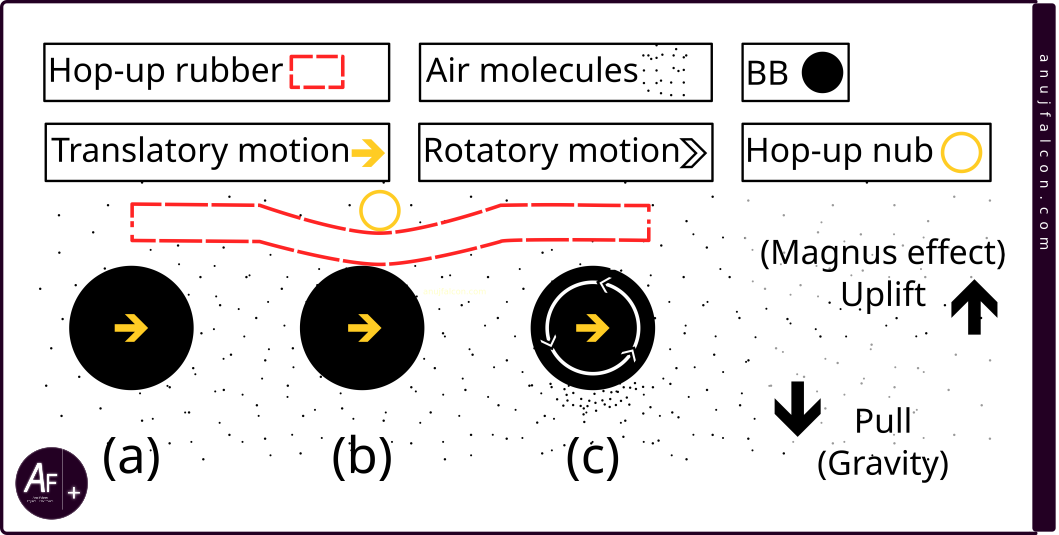
Hop-up is an interesting piece of equipment within an AEG and it’s responsible for feeding the BB to the air piston before it’s fired. It’s also responsible for attaching the air piston to the gun barrel. It’s shown in the top of Figure 2 and detaily annotated in Figure 6 along with the gun barrel. One of the interesting pieces of instrument in it is a small piece of rubber inside the hop-up unit and it rubs against a BB that’s been fired by the air piston, before reaching the barrel. This friction causes the BB to spin. It is illustrated in Figure 7 using three BBs, whose direction of the translatory motion are from left to right. BB (a) has been fired by the air piston, yet to touch the rubber. BB (b) is about to touch the rubber. Both the BBs have undetermined direction for the rotatory motion. BB (c) has touched the rubber and is about to enter the gun barrel with a determined direction for the rotatory motion.
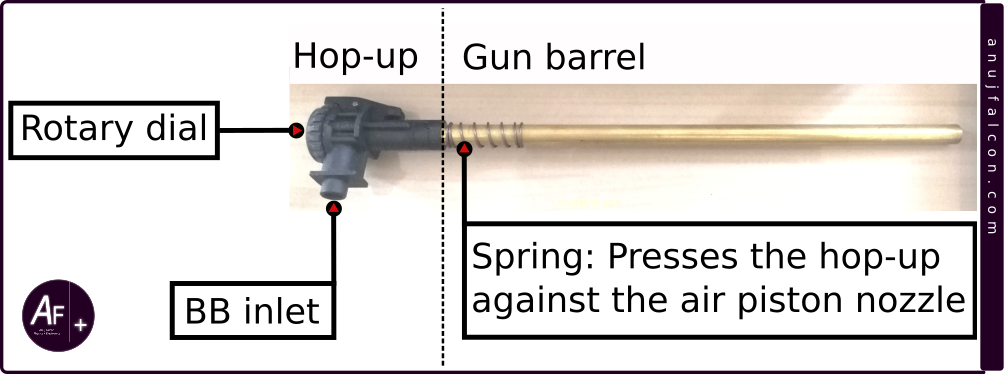
This BB spins in such a way that the top part of the BB when colliding with the air molecules will increase the air molecule’s velocity relative to the BB while the bottom part of the BB collides with the air molecules in such a way that it decreases the air molecule’s velocity relative to the BB. BB by themself will only act like a simple projectile and are not fast enough to reach distant targets without dropping altitude due to the effects of gravity. With the spin, it will be able to fly longer as the higher velocity air on the top will create less pressure while the lower velocity at the bottom of the BB will create more pressure, causing a net upward lift (uplift) that will increase the range of the BB fired by the AEG. It’s called the Magnus effect, a peculiar manifestation of Bernoulli’s theorem. The amount of spin can be controlled by controlling the friction caused by the rubber piece, which is similar to the rubber sleeve i.e. grips found in the writing pen. In my AEG, it can be controlled by rotating a rotary knob found inside the ejection port opened using the charging handle (c.f. Figure 1), which pushes a lever containing a hop-up nub which inturn pushes this rubber sleeve inwards i.e. towards the inside of the barrel. Too much friction causes too much spin and the BB will fly higher than the target. Conversely, too little friction causes the BB to drop faster below the target. The top and bottom part of the BB and barrel are defined by the top (upper receiver) and bottom (magazine and grip) sides of an AEG and not by the surface of earth below or the line of gravity. This is because the hop-up rubber is usually located on the topside and inside the beginning of the barrel. That’s why it’s recommended to hold the AEG with the topside towards the sky and bottom side towards the earth, without tilting it for the Magnus effect to properly counter the effects of gravity. If the gun is tilted, the BB would drop faster and would fly towards left or right, depending on the tilt. What’s funny is that the same air that helps to fly longer against the effects of gravity is also responsible for the BB losing its kinetic energy to the air molecules, therefore losing its horizontal momentum. Further explanation can be found in this video from Youtube by w4stedspace [2].
Motor base plate
The motor base plate, shown in Figure 2, is responsible for positioning the motor (M1) such that its end cap i.e. bevel gear is integrated with the rest of the gearbox at proper tension. Too much or too little tension can be detrimental to the performance of the AEG. This tension is adjusted with the help of a screw located at the bottom of the motor base plate.
Motor (M1)
The type of motor selected for an AEG, such as the one with the high torque or high rotations per minute (RPM) depends on the type of AEG and its user preference. For instance, close quarters battlers (CQB) generally prefer high RPM to eject more BBs per second and long range snipers generally prefer high torque to compress high tensile main springs. Gearbox might also require changes depending on these parameters. In the AEG world, the classification of motors based on the length of the motor shaft is as follows: long, medium and short. The motor used in this article is rated to deliver 25000 RPM with a long type motor shaft. I have no idea about its torque.
Overview of the system design
Remember how I wanted to add a DAQ to the AEG ? The block diagram of the entire electrical system i.e. of both the AEG and the DAQ is shown in Figure 8. This project is slightly different for me as the hardware I usually develop is more of a standalone in nature. In this project, the aim is to design and develop a data acquisition (DAQ) system and integrate it with the AEG controller for monitoring the signals along with the other sensor data such as the data from accelerometer and gyroscope (MPU-6050), without interrupting the AEG’s functionality. This was done using a custom board for simplifying the interfaces and connections between the AEG controller and the DAQ’s backend. The onboard battery that powers the AEG also powers the DAQ’s backend. The data monitored is collected by the DAQ’s backend and sent wirelessly to the server running the frontend of the DAQ. The frontend of the DAQ is a PC running GUI to display the data wirelessly received from the backend (c.f. Section ‘Not practical’ under ‘Observation and discussion’). The wireless protocol used for the data transmission is WiFi.
Hardware description
The schematic diagram of the entire electrical system of the AEG with the DAQ’s backend is shown in Figure 9. The notation used by the connectors / interfaces of AEG controller (C1) in Figure 5 is different from the one in Figure 9 due to the difference in connections. It is because the connections had to be changed to bring the signals to DAQ’s backend, which consists of ESP32 development board (DB1) powered by a buck converter (P1), which was used to step down the 11.3 V from the battery (BT1) to around 4.9 V during closed circuit operation. This voltage level is again stepped down by the onboard regulators of ESP32 development board to around 3.3 V and is used to power the breakout board (S1) named GY-521 that contains MPU-6050 sensor, which is used to monitor its motion along all the six degrees of freedom i.e the translation and the rotation (6DoF). So when the sensor is firmly attached to the AEG, it effectively tracks the motion of the AEG along all the six degrees of freedom by tracking itself. The ESP32 board also has a WiFi transceiver to communicate the data collected from the AEG, including the 6DoF data. The DAQ’s backend derives the energy required for its operation from the battery. The battery (BT1) has 3000 mAh capacity rated at 11.1 V, manufactured by the Titan [3]. It has a maximum C rating of 16C in the nunchuck form factor, which makes it more suitable to fit within the crane stock of the AEG shown in the middle-left of Figure 2. While the connection has been modified due to the introduction of the DAQ system, the connection between the AEG controller (C1), the motor (M1) and the fuse (F1) remains the same when compared to the unmodified AEG.
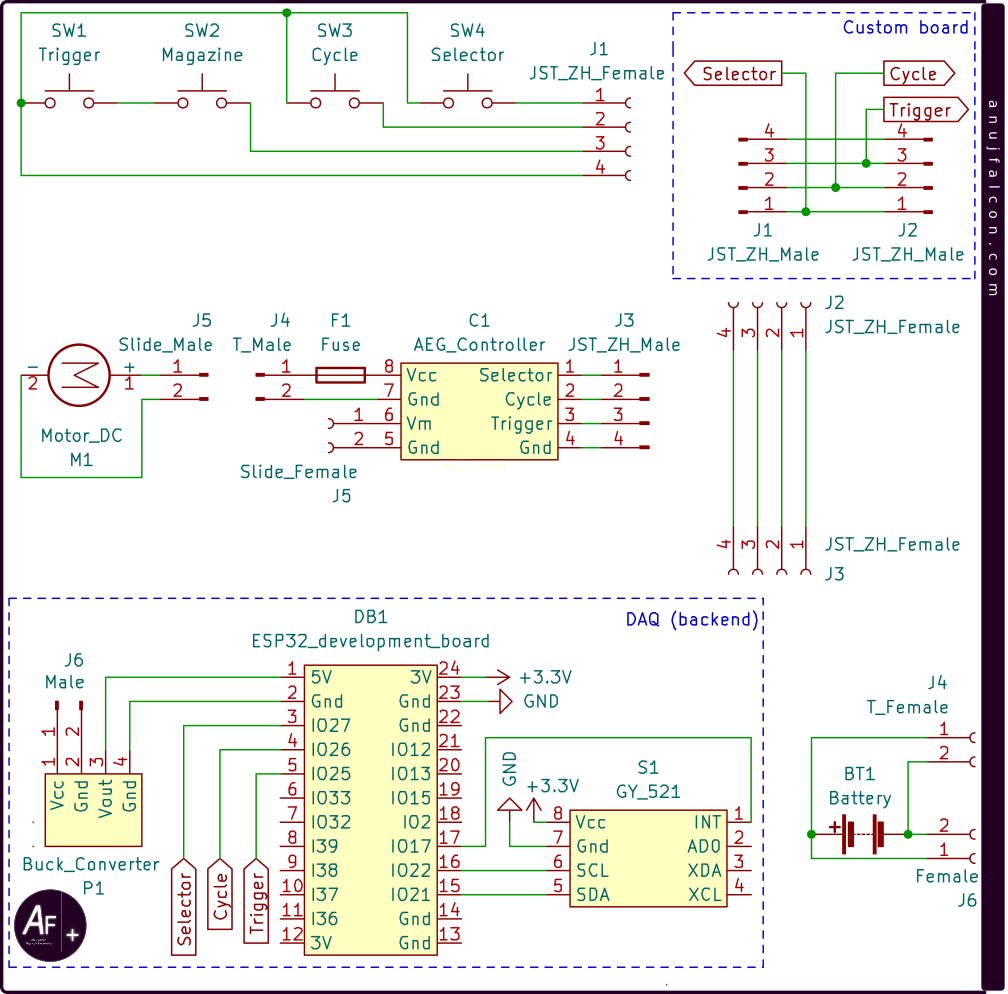
The signals from the AEG along with the ground connection is brought out in the form of a JST ZH female 4 pole connector (female J1) and unlike in Figure 5, it is not directly connected to the AEG controller (C1). Rather, a ‘custom board’ was developed to take care of the signal interface between the AEG, AEG controller and DAQ (backend). It has two JST ZH 4 pole male connectors in it (male J1 and male J2), and the female connector (female J1) from AEG is attached to the male connector (male J1) of this board. The signals, namely the selector, cycle and trigger are brought out from this board and to the DAQ’s backend by directly soldering the wires to the custom board and the ESP32 development board (DB1).
The custom board is connected to the AEG controller through JST ZH 4 pole female (female J2) to JST ZH 4 pole female (female J3) connecting wire. This wire is custom crimped. One end of the wire (female J2) is attached to the JST ZH male connector (male J2) on the custom board and the other end (female J3) is connected to the AEG controller through its male JST ZH 4 pole connector (male J3). The Motor (M1) is directly connected to the AEG controller as usual through a sliding connector (J5). And the battery (BT1) is connected to the AEG controller using the T plug (J4) connector. However, male dupont connectors (male J6) were used to connect to the JST type 2.0 mm pitch 4 pole female connector (female J6, used by the battery for recharging and balancing the energy among the cells within) to power the DAQ’s backend. Connections between the ESP32 development board (DB1), buck converter (P1) and the breakout board GY-521 (S1) are established by directly soldering the wires to the respective terminals. This is also true for connecting signals from the custom board to the ESP32 development board. This direct soldering method was often used, at the expense of easy reworking and modularity due to space limitations (i.e. form factor restrictions) within the crane stock as parts of the DAQ’s backend and the entire of the AEG controller with the battery are placed inside the crane stock belonging to the AEG gun.
Software description - backend
The backend of the DAQ was developed with ESP32 development board (DB1) [8,9], which consists of ESP32-D0WDQ6-V3 system-on-chip (SoC), and is not recommended for new designs [10,11]. The firmware running on this board was developed using ESP’s Integrated Development Framework (ESP-IDF) that has support for RTOS implementation in C [4]. The firmware uses the libraries from ESP-IDF to implement its functionalities, whose flow is shown in Figure 10.
Once the ESP32 development board power cycles, the initial flow of events in the main function (app_main()) are shown in Figure 10(a). It starts by Initializing the I2C bus. This is done by resetting the I2C bus by sending a clock through I2C’s SCL pin and checking if the SDA can be asserted to high level logic. If not, then the process is repeated. If yes, then a stop condition is issued, thus resetting the I2C bus. This is the Solution 1 mentioned in the application note AN-686 from Analog Devices [5] to reset the I2C bus. Once the bus is reset, the I2C peripheral is initiated followed by the WiFi initialisation. It allows the device to connect to the wireless network, whose SSID and Password are mentioned in the file ‘common.h’. Once connected, it synchronizes the system time with the global time by communicating with the internet time server and initializes the MPU-6050 sensor [6,7] using the I2C protocol. Once the sensor has new data available for reading, it interrupts the ESP32 development board through one of its IO. So that IO is also initialized. In order to monitor the input signals, namely the cycle, trigger and selector from AEG, the corresponding IOs are also initialized. Once the IOs are initialized, interrupt routines are attached to two of the four IOs ; the ones that carry the data ready signal from the MPU-6050 and the cycle signal from the AEG. This is followed by initialization of the RTOS task namely the ‘Data collect and transmit’ task. The main function then enters a forever sleep state by entering a super loop with maximum delay.
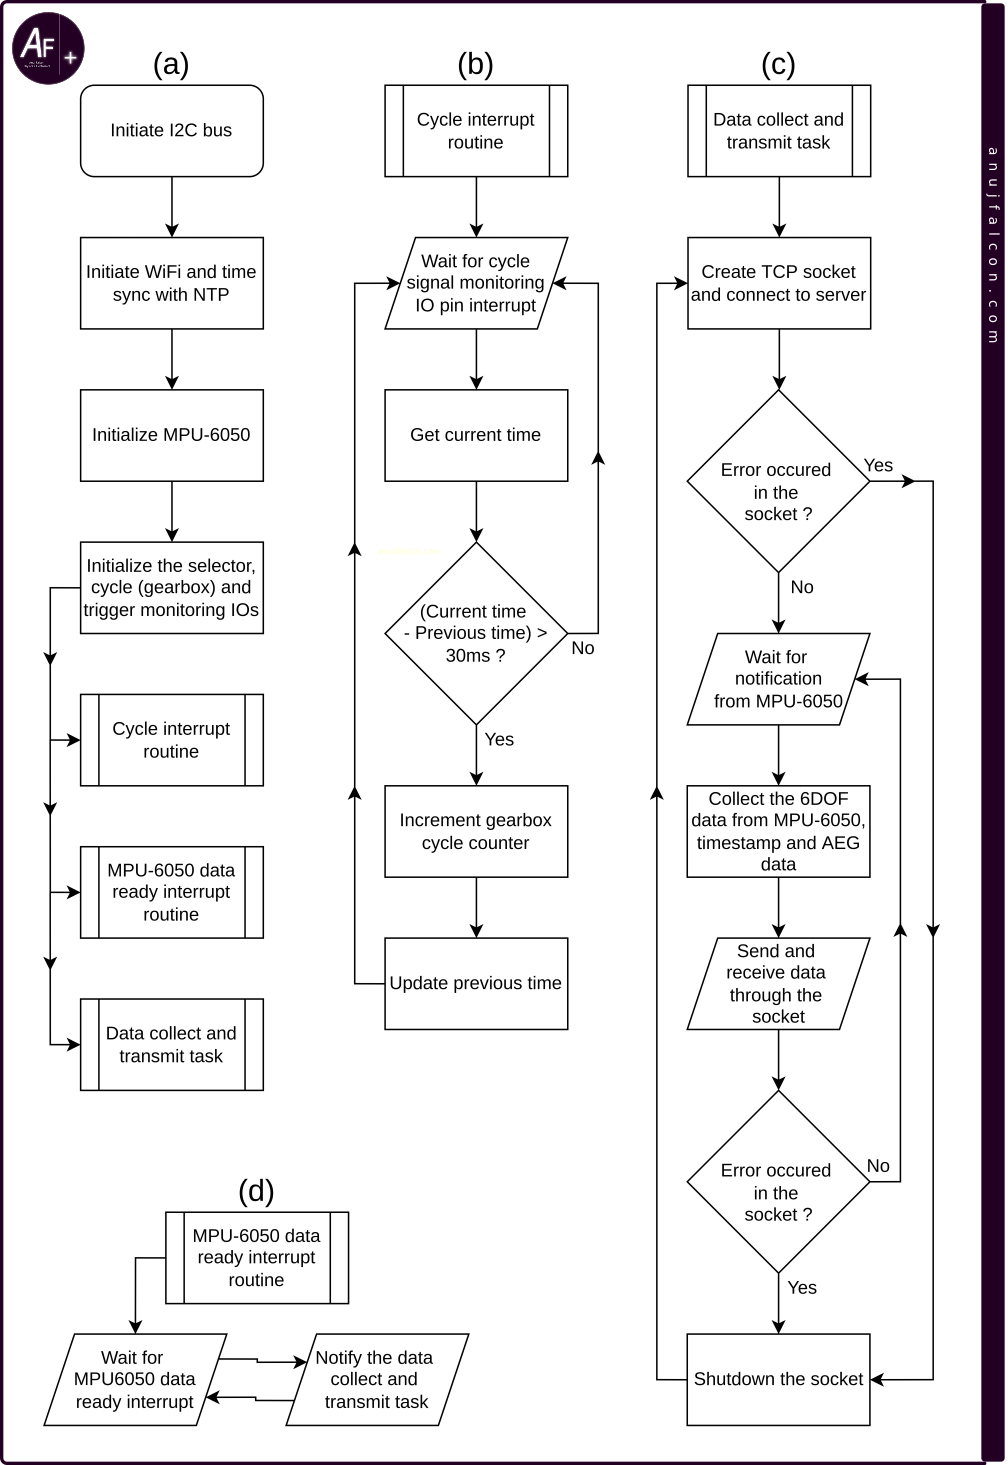
Figure 10(b) shows the flow of the interrupt routine associated with the cycle signal from the AEG. The IO monitoring the cycle signal is configured to call its interrupt routine if it detects a negative edge. Ideally, for a single gearbox cycle, there should be one transition in the cycle signal from high to low (negative edge). But due to the bouncing effect, multiple negative edges are detected for a single gearbox cycle. Hence software debouncing is introduced whereby if a negative edge occurred within 30 ms from its previous occurrence, then it is discarded (c.f. Section ‘Justifying the debounce interval’ under ‘Observation and discussion’). The 30 ms time limit is ensured using the current time (now_ms) variable and previous time (prev_t_ms) global variable. The previous time variable is initialized to 0. When the interrupt occurs, the current time variable stores the current time in milliseconds (ms) since the epoch, which is derived from the output of gettimeofday() function. If the difference between the current time and the previous time is less than 30 ms (which is usually not the case for the first time), then the interrupt routine returns immediately to wait for the next interrupt. Else, the aeg_cycles_counter is incremented to monitor the total number of ‘gearbox cycles’ and the previous time is updated by replacing its value with the current time. The aeg_cycles_counter, under normal operating conditions of the AEG, will represent the number of BB’s fired by the AEG since the power cycle of DB1.
Figure 10(c) shows the flow of events in the data collect and transmit task. The task starts by initiating a few local variables and enters the superloop 1 followed by superloop 2, where it creates a TCP socket (client) and connects to the server, whose IP address and PORT number are mentioned in the file ‘common.h’. If the socket experiences some error while connecting to the server, then the superloop 2 is exited and the socket is shutdown. Then it again goes back to the beginning of superloop 1. But if connected successfully, it enters a superloop 3 where it waits for 1000ms to receive a notification from the MPU-6050 data ready interrupt routine using the function xTaskNotifyWait(). If the notification is received or if the wait time expires, it proceeds to read the MPU-6050 data, get the current time for timestamp, read the state of the trigger and selector signals of the AEG, and copy the current value of the aeg_cycles_counter to compile it into a payload and send it to the server. Once the data is sent to the server, it waits for the data reception i.e. acknowledgement. If the socket experiences some error while sending/receiving the data, then the superloop 3 is exited and the socket is shutdown. Then it again goes back to the beginning of superloop 2. Though it might feel slightly different, the flowchart in Figure 10(c) is functionally equivalent to the explanation above.
Figure 10(d) shows the flow of the interrupt routine associated with the MPU-6050 data ready signal. The IO monitoring the MPU-6050 data ready signal is configured to call its interrupt routine if it detects a positive edge. Once detected, the data collect and transmit task is notified using the xTaskNotifyFromISR() function. This interrupt also acts as a source of clock for scheduling the data collect and transmit task. Software description - frontend The DAQ’s frontend was developed using the Processing 4 software [12], in JAVA language. It’s an opensource tool for a number of things, including visual programming and rapid prototyping of GUI applications. The GUI developed for the DAQ’s frontend is shown in Figure 11. It consists of textual data received from the client, which is displayed on top of the canvas and it is annotated as ‘Data from client’. The status of the three signals, namely the trigger, selector and cycles are displayed on the right side of the canvas. And the MPU-6050 sensor’s data i.e. accelerometer and gyroscope measurements are displayed on the GUI, which are annotated as ‘Recoil data’ and ‘Orientation data’ respectively.
Figure 12(a) represents the default screen displayed as soon as the AEG in ‘safe/semi’ firing mode connects (i.e. DAQ’s backend) to the DAQ’s frontend. The first rounded rectangle on the right from the top is marked ‘TRIG’ and is grayed out to indicate that the trigger is not pressed. The second rounded rectangle on the right from the top is marked semi and painted green. This is to indicate that the AEG is either in safe mode or in semi automatic firing mode. This rectangle changes its color to amber as shown in Figure 12(b) and the marking is changed to auto as soon as the selector switch on the AEG is changed to auto, to represent that the AEG is now in full automatic firing mode. The first rounded rectangle marked ‘TRIG’ changes its marking to ‘Trigger’ and its color from gray to red as soon as the trigger is pressed, as shown in Figure 12(c). The third and the last rounded rectangle on the right from the top is marked ‘COUNT’ and it displays the aeg_cycles_counter value i.e. the number of gearbox cycles completed since the latest power cycle of the ESP32 development board. Let be the maximum number of BBs that’s always refilled in the AEG’s magazine. Then, can give the remaining number of BBs in the magazine.
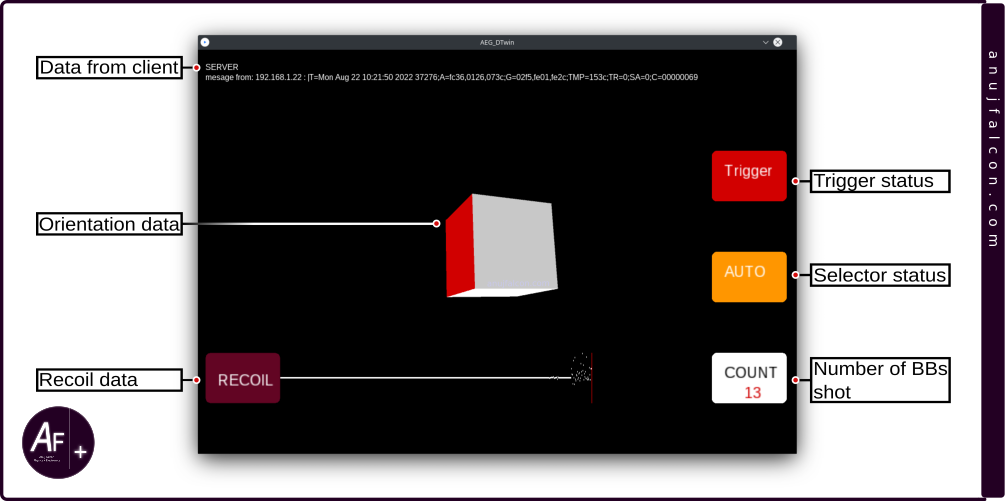
The accelerometer data received from the MPU-6050 sensor is plotted at the bottom of the canvas and labeled as “RECOIL” in a brownish maroon rounded rectangle. Let x, y and z be the vectors of acceleration along the three orthogonal axes of the sensor. Then, the resultant vector’s magnitude is given by \(\sqrt{x^2+y^2+z^2}\) . Subtracting the magnitude of the resultant vector with the magnitude of the acceleration due to gravity gives the net artificial acceleration exerted on the AEG i.e. the MPU-6050 sensor located within the AEG’s crane stock as gravity is also an acceleration (c.f. Section ‘Recoil plot is bogus’ under ‘Observation and discussion’ for more information on why this is not always applicable). The net artificial acceleration’s magnitude is exactly the value being plotted at the bottom of the GUI’s canvas.

Finally, the orientation of the AEG i.e. its angle of rotation along the three axes (yaw, pitch and roll) are tracked using the data from the gyrometer or gyroscope within the MPU-6050 sensor. Let the output from the gyroscope be a, b and c. The unit for these values is angle per second \(\left( \frac{^\circ}{s} \right)\), which represents the angular velocity along the sensor’s X, Y and Z axes. Its value will be zero along an axis if the AEG i.e. the sensor within the AEG stops rotating in that axis. However, its angle of rotation might not be zero and we are interested in it, whose unit is just the angle \(^{\circ}\). Angular velocity is converted to angle by integrating it with time. Riemann sum [17 is used to calculate this integration due to its ease of applicability on a discrete set of values. The discrete set of values are the time series data consisting of angular velocity values a, b and c from the gyroscope sampled at the constant sampling period of 25 ms i.e sampling frequency of 40 Hz (c.f. Section ‘Periodicity of the ‘Data collect and transmit’ task’ under ‘Observation and discussion’), along the x,y and z axis respectively. Riemann sum is applied individually to each of the axes and their angle of rotation along the different axes are tracked separately (cf. Section ‘Rieman sum and periodicity of the samples’ under ‘Observation and discussion’). If the user uses the computer mouse to click on the canvas, then the angle values will be set to zero and the tracking would start again. In order to represent these angles virtually, a 3D cuboid (annotated as orientation data in Figure 11) is displayed and rotated along all the three axes using the angle value obtained from Riemann sum. The MPU-6050 sensor was attached to the AEG in such a way that the face of the cuboid painted red represents the side of the AEG containing the muzzle and rotating the AEG would rotate this cuboid accordingly (c.f. Section ‘Error in GUI with the orientation data’ under ‘Observation and discussion’).
The flowchart of the Java language coded program executed in the Processing 4 IDE running on a PC is shown in Figure 13. Specifically, Figure 13(a) represents the flow of events on the main process (setup() and draw() functions) which begins by displaying the canvas of the GUI on the PC screen, initiating the GUI reset routine and initiating the TCP server for the DAQ’s backend to connect to it. If the client (i.e. DAQs backend) is not connected then it waits until the client is connected. Else, it proceeds towards receiving the data from the client, where it waits until the client data is received and acknowledges the data reception by simply sending the string ‘cool’. Between the data reception and acknowledgement, the received data is decoded and the relevant parts of the GUI are then updated. The GUI reset routine is shown in Figure 13(b). It waits for the user to click anywhere on the canvas. Once the click is detected, the GUI is reset. Currently, the only thing that is reset is the orientation data i.e. the position of the 3D cuboid displayed by the GUI.
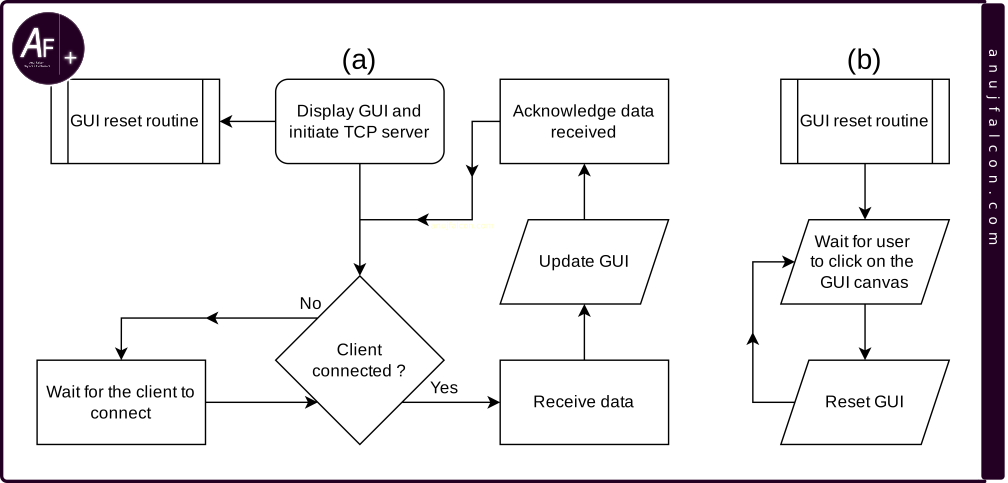
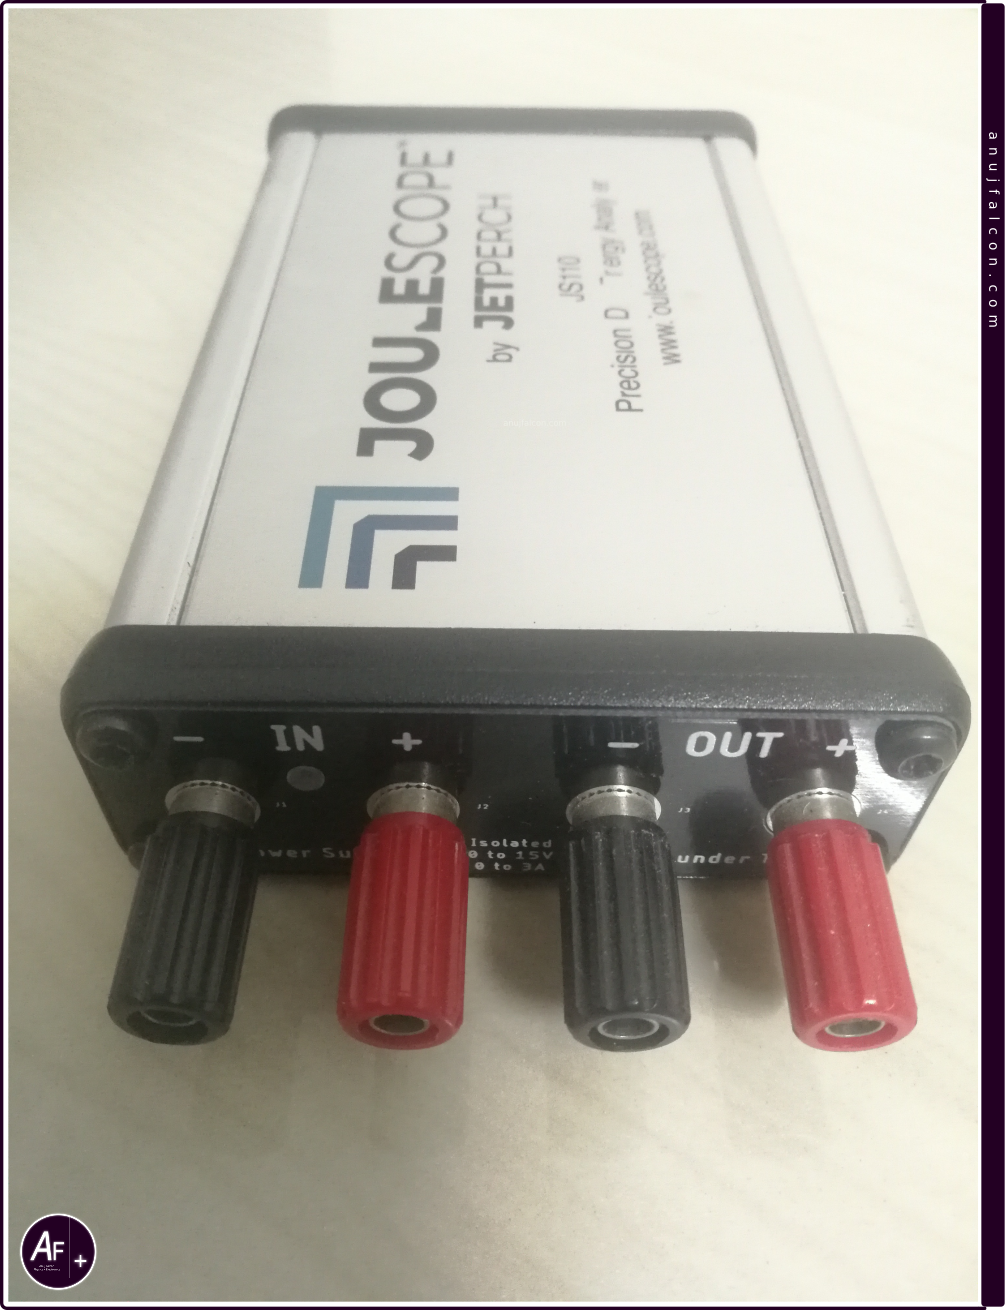
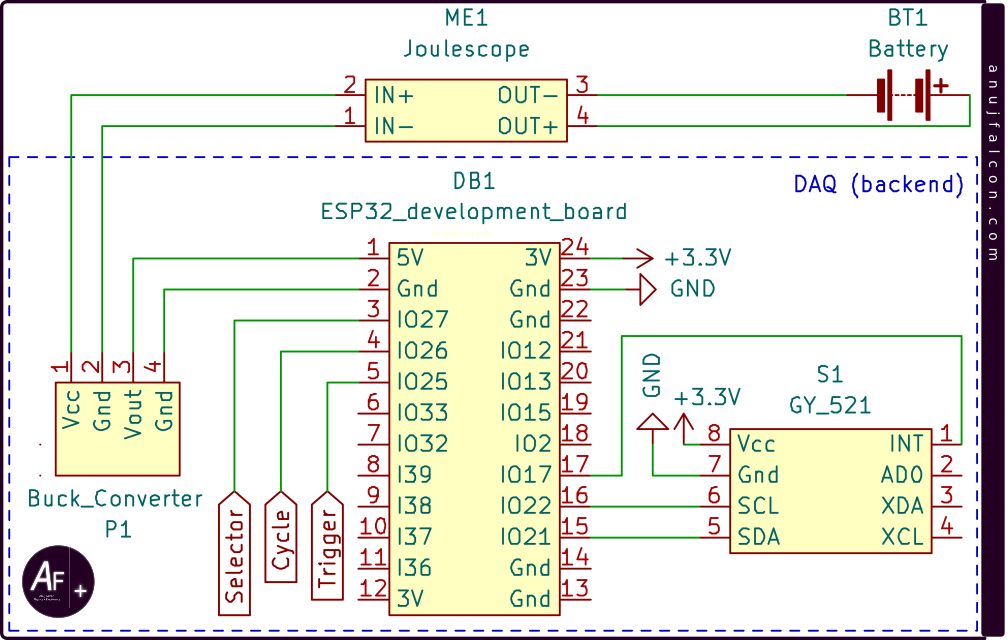
The use of TCP instead of UDP protocol for data transfer, to some extent, ensures the reliability of the data transfer by enforcing acknowledgement for each packet at the protocol level. SInce my understanding of the protocol is not deeper, I decided to implement a simple acknowledgement mechanism on top of the TCP, using the string ‘cool’, which is to be transmitted back to the client after every payload received by the server. Electrical power profile of DAQ’s backend The backend of the DAQ consumes its power from the battery (BT1). The amount of power consumed and the Voltage-Current (VI) characteristics of DAQ’s backend is obtained using a measurement device (c.f. ‘ME1’ in Figure 15 and Figure 18) named Joulescope [14] and it is shown in Figure 14. It has four screw terminals, two status indicating LEDs and a USB type B female port. It also has six 1.5 mm dupont female ports arranged in two rows. The USB type B female port helps in connecting the device to the PC containing USB type A female port using a USB type A male to type B male cable. The screw terminals also have female banana plug terminals in them, which was extensively used for this project. In order to measure the power flowing to the DAQ’s backend, it must be connected to the output terminals (marked OUT) of the Joulescope. This was done using a male banana plug to crocodile clip terminating cables, where the clips connect to the J6 male dupont connectors of the DAQ’s backend (c.f. Figure 9) and the male banana plugs are connected to the female banana plug terminals in the Joulescope marked ‘OUT’. The remaining two screw terminals marked ‘IN’ are used to connect the power source i.e. the battery (BT1). This was done using two single core wires, where one end of the wires are inserted into the positive and negative terminal of the battery (BT) through its female J6 connector (c.f. Figure 9). And the other ends are connected to the crocodile clips of the crocodile clip to male banana plug terminating cables. The male banana plugs from this cable are used to connect to the female banana plug terminals on the Joulescope marked ‘IN’. Care must be taken to make sure the polarity of the connections are proper. The schematic diagram of this measurement setup is shown in Figure 15. Once the connection is complete, it is time to start measuring the electrical parameters from Joulescope using the Joulescope UI [15] by running it on a PC.
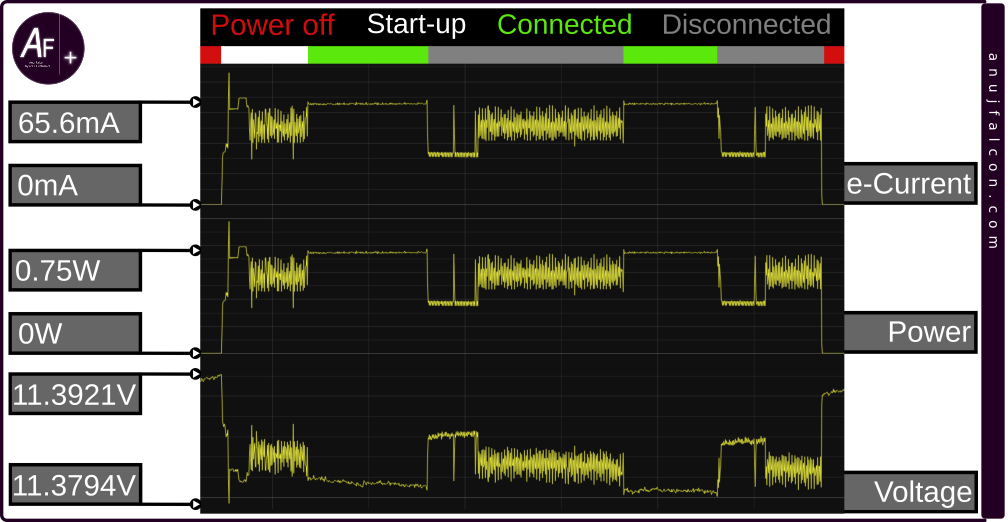
During measurements, Joulescop UI has options to turn off the power output, fix the electric current and voltage sensitivity range, etc. I suspect that the option to turn off the power in Joulescope is done by using an electronic MOSFET. Because when the roles of the input and output screw terminals were reversed, I was not able to turn off the power, suggesting that the power could have flown through the body diode of the MOSFET. The electric current range during the period of the measurement was fixed to prevent automatic changing of the shunt resistor in the middle of the measurement, as it can cause unexpected patterns in the electrical data. Figure 16 shows the trend in the voltage, electric current and power consumed overall by the DAQ’s backend, measured using the Joulescope which is connected to the DAQ’s backend as shown in Figure 15. Figure 16 has the time axis marked with red, white, green and grey colors, which is noticeable on the top of this figure. Red indicates those time periods during the measurement when the power to the DAQ’s backend was cut-off. White indicates those time periods during which the DAQ’s backend was undergoing startup procedures, post a power cycle. Green indicates those time periods during the measurement where the DAQ’s backend was connected to the DAQ’s frontend wirelessly and was transmitting data. And finally, grey indicates those time periods during the measurement where the DAQ’s backend was disconnected from the DAQ’s front end server, but was still connected to the WiFi network. When the DAQ’s backend is connected and transmitting data to the DAQ’s frontend, the average power consumed was around 750 mW, where the electric current consumed was around 65.6 mA at 11.4 V voltage level.
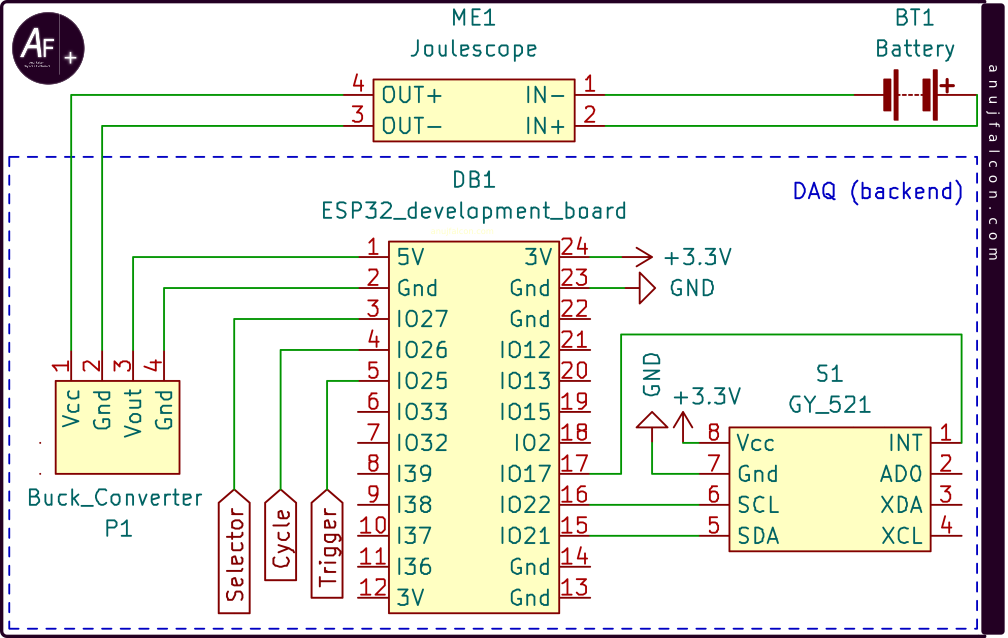
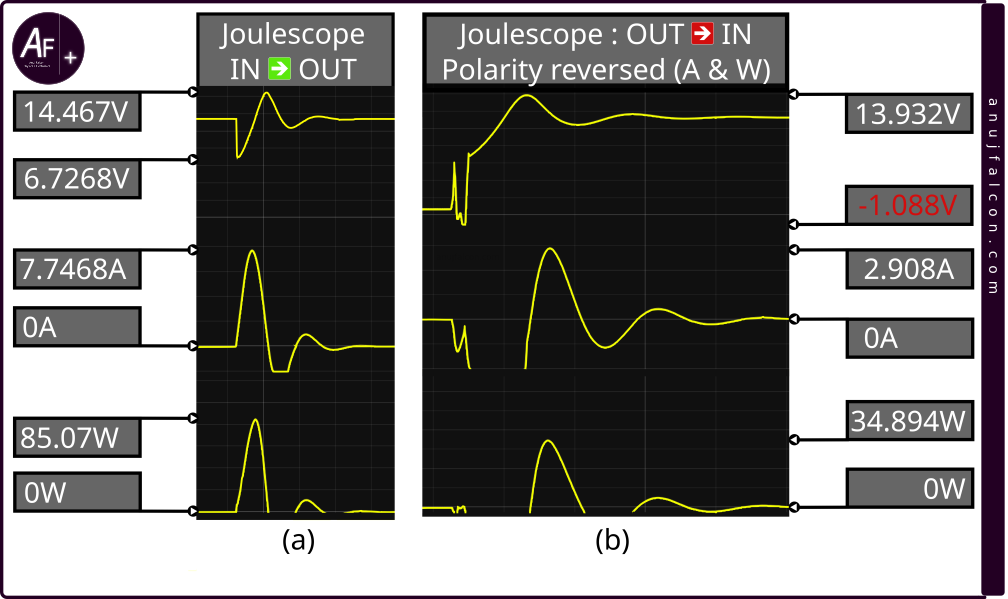
Something interesting to note in Figure 16 is its characteristics at the startup, where we can see a spike in current and power. I tried to examine the startup part of the measurement by measuring it using the same connections as before, as shown in Figure 15. The zoomed in version of this measurement is shown in Figure 17(a). During the startup, the voltage, electrical current and power reached a maximum of 14.47 V, 7.75 A and 85.07 W respectively. The voltage had a minimum value of 6.73 V. However, something interesting happened while trying to measure the minimum of other values. The measurements of the other values’ minimum (electric current and power) were cut-off due to the range limitation of the device for the negative values. For instance, the electrical current measurements displayed by the Joulescope UI didn’t go below approximately -2 A during the measurement process (even at higher electric current sensitivity range), which can be also seen in Figure 17(a). Hence, a new strategy was devised wherein I switched the input (IN) and output (OUT) connections to the Joulescope as shown in the schematic circuit diagram in Figure 18, and continued with the measurement. This will reverse the direction of the electric current and hence its mathematical sign will invert, but the voltage’s mathematical sign (polarity) remains the same.
Table 1: Electrical data of DAQ’s backend.
| Scenario / Task | Electrical current | Voltage | Power |
|---|---|---|---|
| Maximum (startup) | 7.75 A | 14.47 V | 85.07 W |
| Average (connected) | 65.6 mA | 11.4 V | 0.75 W |
| Minimum (startup) | -2.9 A | 6.73 V | -34.89 W |
One issue with this measurement setup is that, as discussed above, it won’t allow for the power to be disconnected through software. But in order to measure the startup electrical characteristics, it is necessary to turn off and turn on the power to DAQ’s backend. Hence, it was done manually by unplugging and plugging the banana connectors connected to the Joulescope terminals, whose bouncing effect (ripples) in the measured parameters can also be seen in Figure 17(b), at the beginning (which is almost non-existent in Figure 17(a)). Regardless, we got the minimum electric current and wattage consumed by the DAQ’s backend, which is around -2.9 A and -34.89 W, respectively. The maximum and minimum values of the electrical parameters measured for the DAQ’s backend (during the startup), along with average values of the electrical parameters measured while the DAQ’s backend was connected to the TCP server and transmitting data normally is tabulated in Table 1.
Observation and discussion
Some of the observations made during the development of this project and this article are listed in the paragraphs below as subsections.
Periodicity of the ‘Data collect and transmit’ task
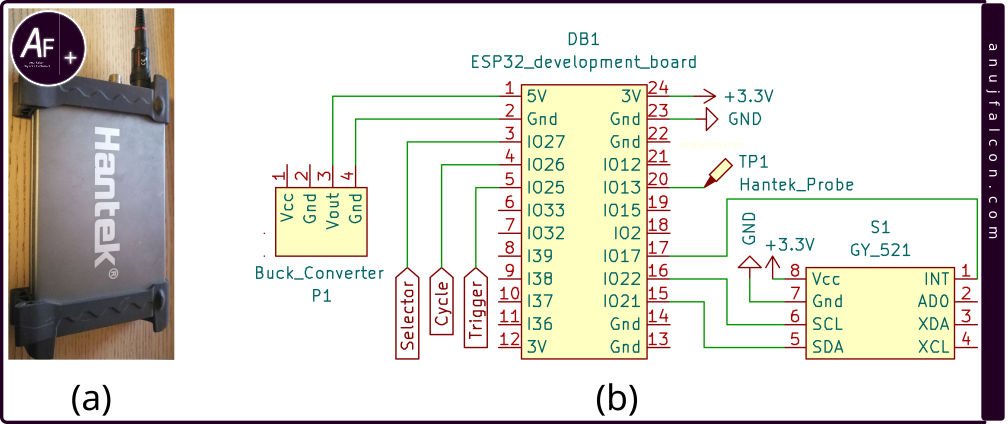
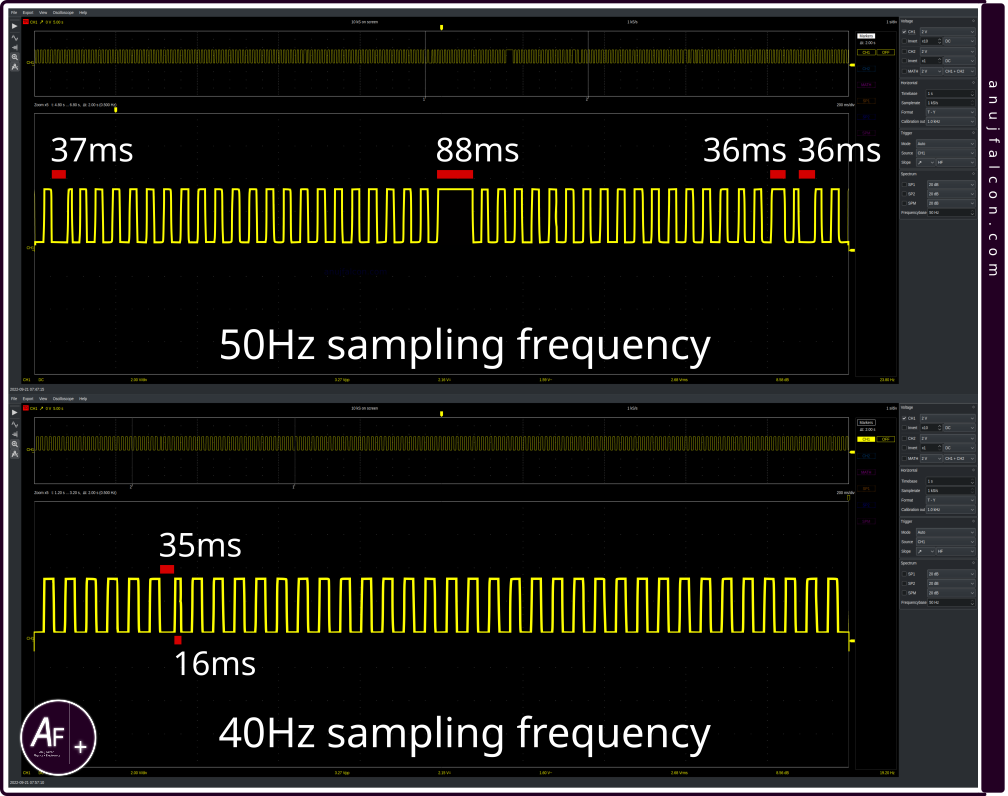
MPU-6050 sensor is responsible for notifying the ‘Data collect and transmit’ task, thus triggering the execution of an iteration within this task, which is required to be periodic. Hence this task has real-time constraints. MPU-6050 sensor causes interrupts whenever the sensor has collected a sample. And the associated interrupt routine notifies the ‘Data collect and transmit’ task. Attempts were made to increase the sampling frequency as much as possible. And the sampling frequency of the MPU-6050 sensor was chosen as 40 Hz i.e. the sampling period of 25 ms due to the less occurrence of aberration in the periodicity of the real time task, which was manually observed by making the GPIO 13 of ESP32 development board toggle whenever the ‘Data collect and transmit’ task properly receives the notification from MPU-6050. A Hantek 6022BL USB based oscilloscope shown in Figure 19(a) was used to monitor this signal. The schematic diagram of the circuit used to monitor this signal is shown in Figure 19(b). The TP1 is the oscilloscope’s probe tip connected to GPIO 13. Both the ESP32 development board and the oscilloscope were powered through the USB interface of the same PC hence they share a common ground. Figure 20 contains two edited snapshots of the Oscilloscope’s GUI stacked on top of one another, where one on top represents the waveform generated by the GPIO 13 when the sampling period is 50 Hz and another represents the waveform generated by GPIO 13 when the sampling period is 40 Hz. The GUI was displayed by Openhantek6022 [16] software running on the PC, which is a community developed open-source software for Hantek Oscilloscope 6022BL. During this monitoring process, the frontend of the DAQ was active and it was receiving the data from ESP32 development board.
Using a higher sampling frequency like 50 Hz often caused huge aberrations in the real time task’s periodicity, as shown in the top of the Figure 20, where the ideal time period between successive edges should be 20 ms but can be seen to reach upto 88 ms. 40 Hz sampling frequency was not aberration free but the number of samples collected within a certain time period often coincided with the number of samples expected within that certain time period. Hence 25 ms was chosen as the sample period value during the experiments. The output from the GPIO that was toggled when sampling frequency was 40 Hz is shown in the bottom of the Figure 20, where the ideal time period between successive edges should be 25 ms. Nonetheless, on rare occasions, huge aberrations in the periodicity also occurred at 40 Hz sampling rate, which needs to be addressed in the future. Another cause of this aberration could be me and my lazy development skills, otherwise known as rapid prototyping. One thing to note in Figure 20 is that the waveform displayed / generated by the GPIO should ideally have a frequency half that of the sampling frequency of MPU-6050 sensor with 50% duty cycle as two edges are required to generate one wave. However, each edge represents that a notification was received, a sample was collected and processed.
Rieman sum and periodicity of the samples
This aberration in periodicity has a deeper impact than just deadline misses for the real time ‘Data collect and transmit’ task. It’s because the sampling period value is assumed to be constant and it is also used for calculating the angle traversed using Riemann sum, along with the angular velocity data obtained from the gyroscope. It also means that there is an inherent assumption by software that the angular velocity data is obtained at regular time intervals. Ideally, angular velocity data is expected to be collected at regular time intervals with the interval being the sampling period. This creates a discrete set of data points, which can then be used to form rectangles as shown in Figure 21(a). Adding the area of these rectangles gives the angle traversed within the time period between the first and the last data point. But due to the aberration in periodicity of ‘Data collect and transmit’ task, the interval between the data points changes. But this change is currently not taken into account by the software. Hence, it calculates the area of the rectangles, similar to the ones shown in Figure 21(b), in which all the rectangles have the same width. Here,some of the rectangles are overlapping with one another and some of the rectangles don’t have their sides properly aligned to the adjacent rectangles.
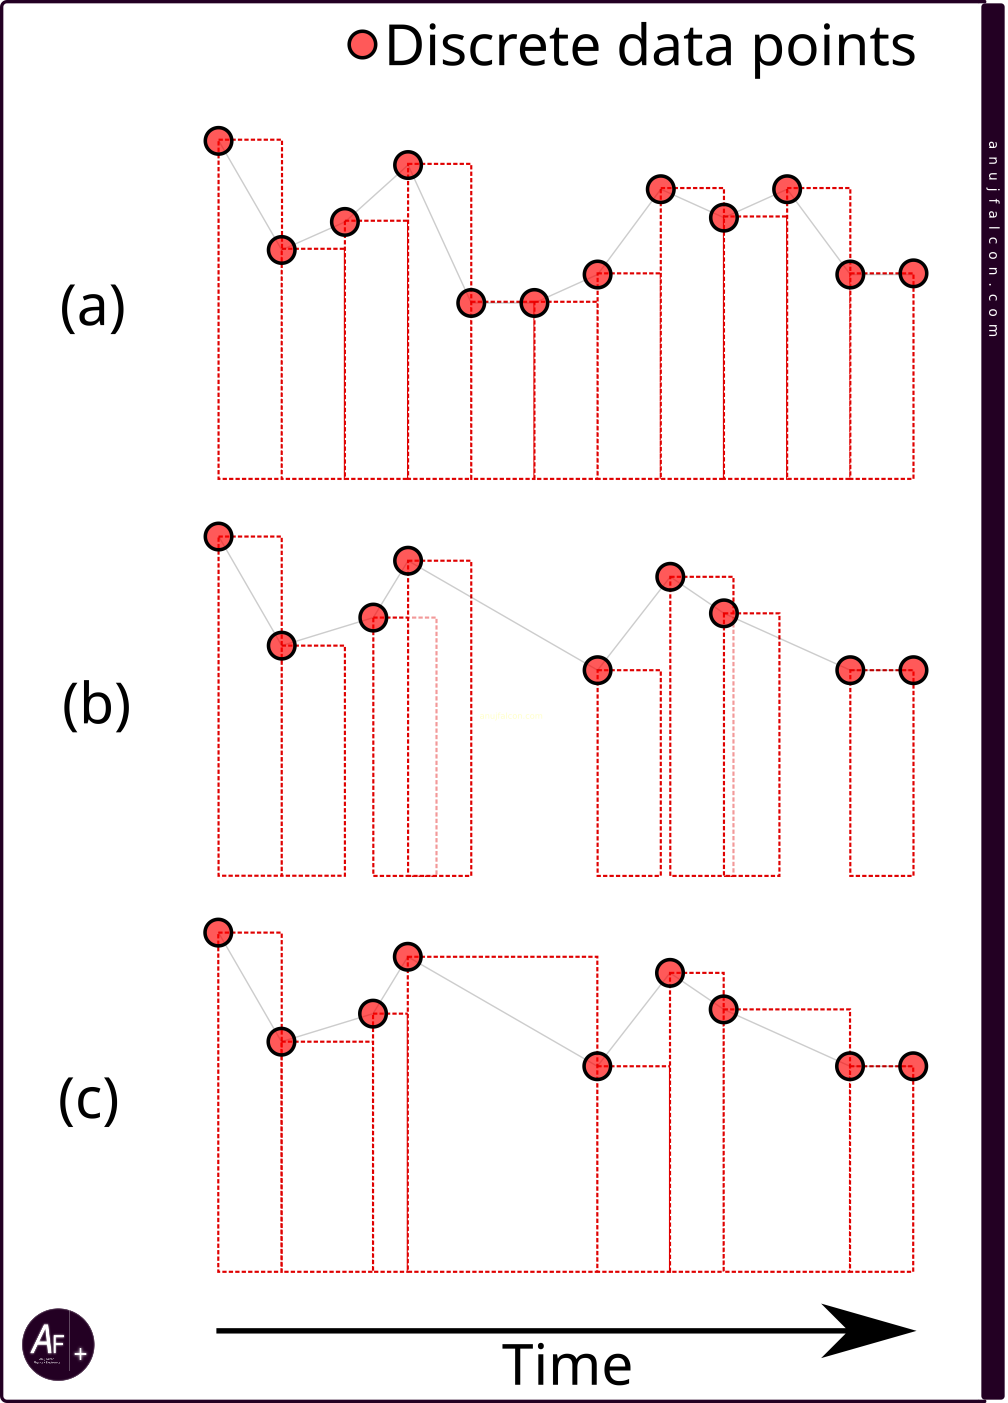
This introduces error in the calculated angle of traversal. This error can be reduced by either collecting the data periodically as shown in Figure 21(a) or by taking into account the change in width of the rectangle i.e. the irregular interval must be taken into account before calculating the area of the rectangle, as shown in Figure 21(c). Another thing to note is that the type of Riemann sum used in the illustration by Figure 21 is called left Riemann sum as the top-left corners of the rectangle are touching the data points. It also means that a sample collected is valid for the entire time period following it, until the time when the next sample is collected. If the right Riemann sum was used instead of left, then the top-right corner of the rectangle would be touching the data points and a sample collected would have been valid for the time period before it was collected, until the time when the previous sample was collected. Riemann sum is usually associated with the integration of continuous data. Hence it’s said to approximate the integrals calculated using this method. However, in our scenario, with a discrete data set and the assumption that a data point in that set is valid for a certain interval (i.e. entire width of its rectangle) makes it more than just an approximation. More information about the Riemann sum can be found here [17,18]. The aberration in this periodicity, coupled with the error (noise) in the gyroscope measurements is suspected to cause “phantom rotation” of the cuboid. For instance, leaving the GUI and the GY-521 breakout board containing MPU-6050 sensor untouched during the experiment still caused the cuboid to rotate on its own to a different position, even though the MPU-6050’s position was locked with a table weight.
AEG signals and periodicity of the ‘Data collect and transmit’ task
The voltage levels of the trigger and selector signals from the AEG are only sampled by the data collect and transmit task whenever it’s about to compile the payload for sending it to the server. So if these signals were to make a transition from high level to low level and then back to high level within 25 ms (periodicity of this task, which is also affected by the aberration), it might not even get sampled to be displayed by the GUI. Since these signals are associated with user inputs, I doubt if this sampling period will be a high priority problem (assuming these signals faithfully represent the user input and we are not interested in monitoring the aberrations in this signal).
Polarity check
During one of the experiments, the AEG would not fire and the AEG controller kept beeping. Upon further inspection. I noticed that the polarity of the wires connected to the motor had been reversed. This caused the motor to spin backwards but the anti-reversal latch within the gearbox prevented this motion, causing a short circuit through the motor coil, which I suspect, tripped the overcurrent protection within the AEG controller. This is my theory on why the AEG controller beeped. However, no specific status indicator exists to let the user know that the polarity of the power connector to the motor has been reversed (maybe a bit too much to ask).
Hardware design caveats
Note that the 5 V pull up resistors maintain the default stable state of the AEG signals (trigger, cycle and selector) as high logic level but the signal was also connected to the DAQ’s backend (ESP32 development board). During the experiment, the AEG kept firing uncontrollably, every time when I tried to power the DAQ’s backend through the battery, while the AEG controller was always attached to the battery. This happens only when I first connect the ground instead of the high voltage line from the battery to the DAQ’s backend. Connecting the high voltage line of the DAQ’s backend first resolved this issue. This was because when ground was connected first, the default high logic level state of the signals was changed to low logic level by the DAQ’s backend (ESP32 development board) passively, which I suspect is due to the clamping diodes or snapback circuits protecting the GPIOs from overvoltage. Regardless, this issue needs to be addressed and it’s something to be considered seriously during the experiment and future developments. For now, It is best to disconnect the AEG controller from the battery (J4 disconnect), connect the DAQ’s backend to the battery (J6 connect), and then connect the AEG controller to the battery (J4 connect). Another caveat in the design is that no switch exists to disconnect the power to DAQ’s backend and it needs to be manually done by pulling the J6 male and J6 female connectors apart. Besides, no intentional user interface exists on the DAQ’s backend. Another thing to note is that no fuse exists between the battery and the buck converter, which is a mistake (cf. Figure 9).
Time period of operation estimation
When the DAQ’s backend is connected to the network and transmitting data to the DAQ’s frontend, it consumes nearly 750 mW. Since the battery (BT1) has a capacity to store 33 Wh of energy i.e. around 118.8 kJ of energy, assuming its fully charged, assuming we don’t want to deplete the battery below 50% of its capacity and assuming only the DAQ’s backend is operating (not a preferred assumption), it can operate continuously for about 22 hours before depleting the energy stored in the battery to about 50% of its full capacity. However, the calculated continuous operational hours will be reduced further when it’s combined with energy consumption made by AEG’s primary operations i.e. firing BBs.
Not practical
Even though in the introduction I stated that I would like to monitor the BBs in the field to not waste them, the project developed and briefed in this article for the stated purpose is not very practical for that scenario in its current state as the dashboard that counts the number of BBs remaining in the magazine needs a LAN and a PC. One reason was because in the middle of the project, I suddenly diverted my attention to the concept of digital twins and other stuff. Besides, I have always wanted to see a 3D cuboid rotating based on the orientation of an object I control (Childish me!).
T plug
Something to consider while purchasing an AEG with AEG controller and battery is the type of connector used to connect the battery to the AEG controller. I personally requested the Deans / T plug type connector based interface instead of Tamiya connector based interface due to the larger contact surface (thus reduced contact resistance) and firmer connection made by the T plug style connector. Besides, it also helps me in standardizing the battery interfaces in my personal projects and enables easy prototyping along with simplified management / maintenance of batteries and battery connectors. However, something tells me that I might have to switch to XT60 soon.
Anomaly in electrical profile
If you take a closer look at Figure 16, Figure 17(a) and Figure 17(b), a small anomaly exists in the voltage waveform. When the device is said to be powered off, the current and power declines to zero in all the three figures. However the voltage does not go to zero, both in Figure 16 and Figure 17(a) which is because the voltage values reported by Joulescope UI are measured at the input terminal but not at the output terminal and the roles of input and output terminals were not reversed. The power flow was controlled through Joulescope’s software controlled electronic switch. However, in case of Figure 17(b), the roles of the input and output terminals were reversed. The power flow was controlled manually by plugging / unplugging the output connectors. So, when either the positive connector at the output or the negative connector at the output was disconnected, the voltage measured drops to zero. When the input and output terminals of the Joulescope are not reversed, measuring voltage parameters at the input terminal rather than the output terminal can cause errors in the measurement of the power consumed by the devices connected at the output as the voltage will include not only the voltage across the device connected to the output but also the voltage across the shunt resistor used for electrical current measurement, which can result in slightly elevated power consumption values for the device connected at the output, depending the shunt resistance and the electric current flowing through it. On the other hand, power dissipated from the source (input) will be accurate.
While measuring the electrical parameters at the startup period of the DAQ’s backend using the schematic diagram in Figure 18, ripples in the measurements can be seen due to the bouncing effect arising out of manual unplugging and plugging of banana plug, which can be seen in the beginning of Figure 17(b) when compared to the smooth rise in waves at the beginning of Figure 17(a). I suspect that this could have compromised the minimum values measured for electric current and power during startup. Better setup will be utilized to measure this value next time.
Recoil plot is bogus
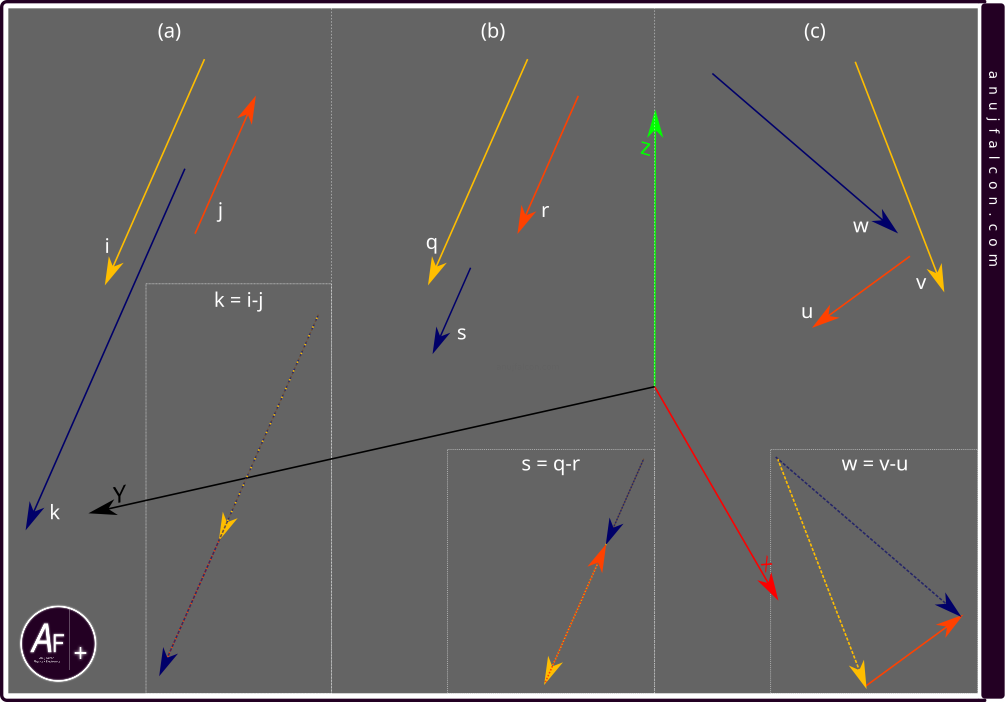
The recoil label shown in Figure 11 and Figure 12 does not actually represent the recoil of the AEG but all the artificial acceleration exerted on the AEG, which was measured by subtracting the magnitude of natural acceleration i.e. the acceleration due to gravity from the total acceleration measured. Even that exclusion was erroneous by the standards of vector mathematics [19]. For instance, when subtracting two vectors, one can directly subtract the magnitudes of those two vectors to find the resultant vector’s magnitude, provided they both have the same direction, which is illustrated in Figure 22(b), where the vector q and r have same direction and when subtracted, the magnitude of the resultant vector s is represented by the length of its line and it’s simply equal to the difference between the lengths of lines (vector magnitude) q and r. I somehow assumed that this will always be the case and subtracted the magnitude of acceleration due to gravity from the magnitude of total acceleration measured by the MPU-6050 sensor. This is wrong as the direction of the total acceleration can be different from the direction of the acceleration due to gravity. This is illustrated in Figure 22(c) using vector u and v, which has different directions. The resultant vector w obtained by subtracting u from v has a length (vector magnitude) definitely more than the difference between the lengths (vector magnitudes) of the vectors u and v. This is why naively subtracting vector magnitude without considering the direction results in erroneous resultant vector magnitudes. Also, something interesting to note is that when the vectors are antiparallel, like vectors i and j shown in Figure 22(a) , the subtraction between those two vectors results in a resultant vector k, whose length (vector magnitude) is actually addition of the lengths (vector magnitudes) of vector i and j.
Justifying the debounce interval
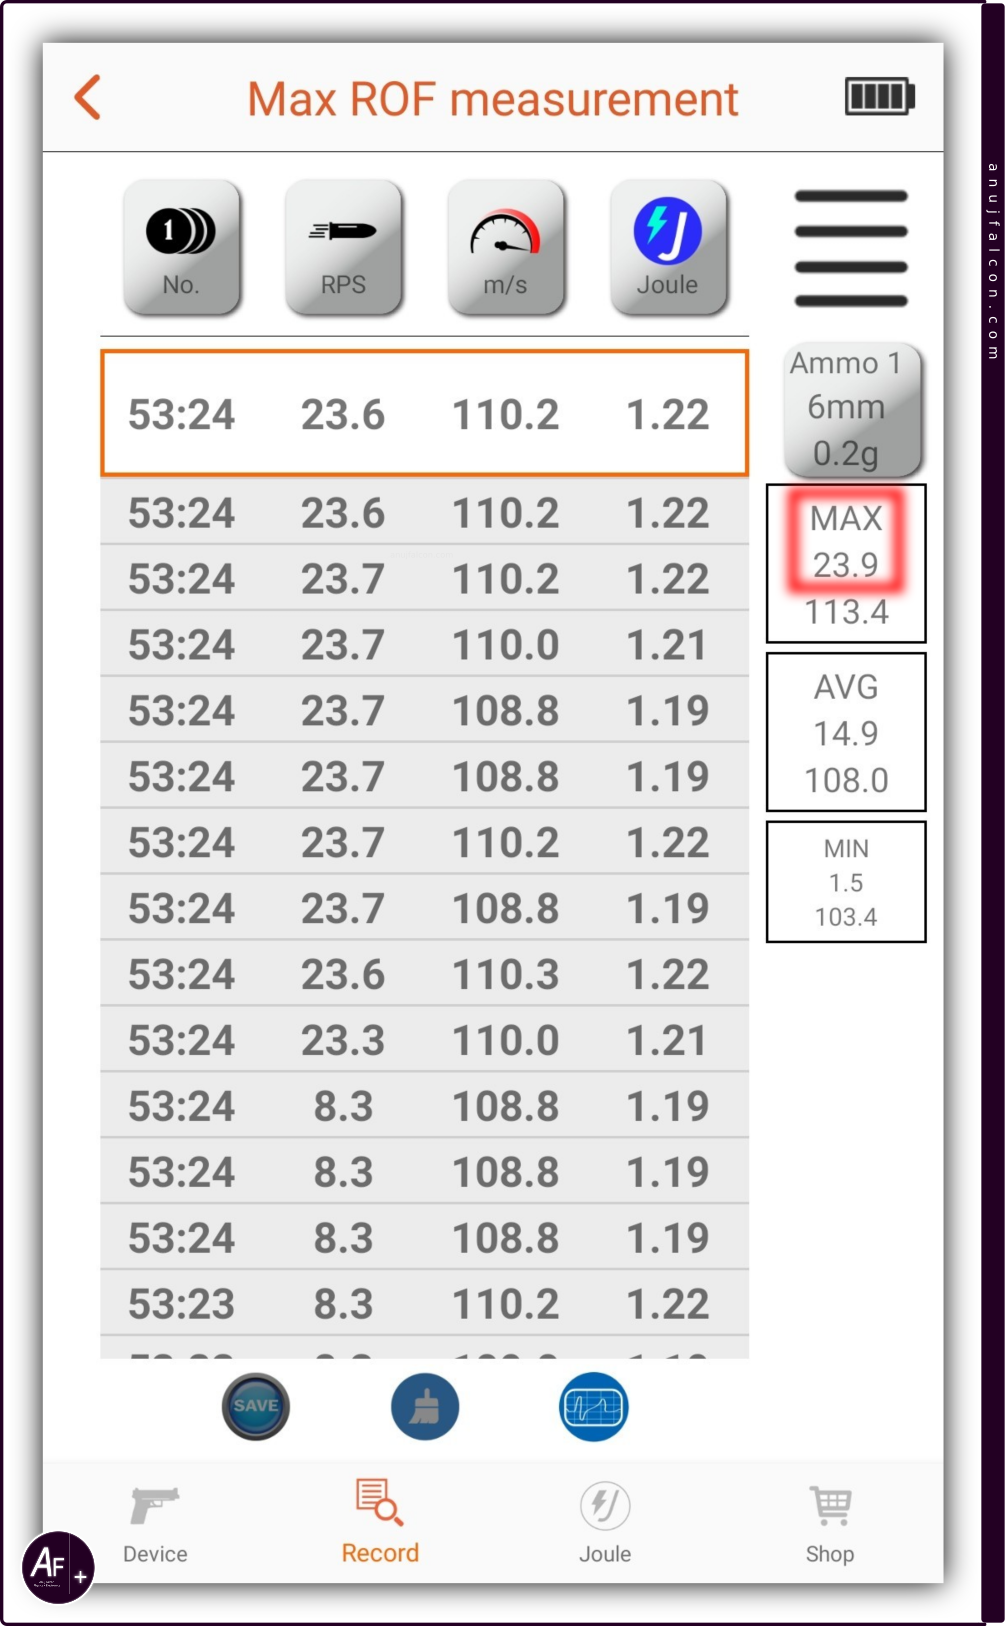
The 30 ms (0.03 s) time interval introduced to debounce the switch SW3 (c.f. Section ‘Hardware description’ and Figure 9) using software (c.f. Section ‘Software description - backend’ and Figure 10(b)) has a negative impact, if the AEG’s maximum rate of fire (ROF) is greater than \(\frac{1}{0.03}\) i.e. around 33.3 BBs per second. Because if the maximum ROF is greater than 33.3 BBs per second, then the time interval between the two ‘gearbox cycles’ might be less than 30 ms, and one of those cycle signals caused due to the actual ‘gearbox cycle’ will be ignored due to the software debounce mechanism. For instance, let’s assume the maximum ROF is 34 BBs per second. Then the time between two ‘gearbox cycles’ can be as high as around 29.4 ms, which is less than 30 ms and if a valid cycle signal transition were to occur from high to low logic level (second signal) after a previous valid cycle signal transition (first signal) at that ROF, then the second signal is going to be ignored due to the software debouncing and the aeg_cycles_counter will not be incremented. And as a result the number of BBs reported by the GUI of the DAQ’s frontend will remain the same as after the first cycle signal, even though a BB corresponding to the second signal has left the magazine. I somehow heard that the maximum ROF for the AEG used in this project is 24 BBs per second. Since I could not find it in the reference data [1], I measured the ROF of the AEG using the ACETECH Lighter BT tracer unit [12] with the AEG in ‘auto’ firing mode as it should result in the maximum ROF possible by this AEG and the results are displayed in the tracer unit’s app as shown in Figure 23. The maximum ROF measured is highlighted on the right with a blurred red color rectangle and its value is around 23.9 BBs per second, which results in a minimum time between two BBs ejected or two valid gearbox cycles to be around 41.8 ms, and that is greater than 30 ms. So software debouncing has no negative impact in counting the number of BBs in this AEG. In case of this AEG, if a cycle signal transition occurred within the time period of around 41.8 ms since the previous cycle signal transition, then it’s probably a false positive for a ‘gearbox cycle’, which could be due to bouncing or other reasons.
Error in GUI with the orientation data
The X and Y axis of the MPU-6050 sensor is marked on the silkscreen of GY-521 with an arrow. The sign of acceleration value measured by the sensor along its X and Y axis when each of the axes’ arrows were pointed towards the earth such that they were approximately perpendicular to the surface of the earth was negative. Hence, the X and Y axes are (weirdly) pointing in the direction of decreasing value. Since the Z axis was not marked, the direction of the Z axis’ arrow was assumed to be along the direction of the acceleration due to gravity, when the Z axis was approximately perpendicular to the surface of the earth and the sign of the measured acceleration was negative along the Z axis. After orienting the sensor, during the measurements, the sensor was kept as still as possible to reduce the effect of artificial acceleration. The assessment suggests that the right-handed cartesian coordinate system is being followed by the sensor.
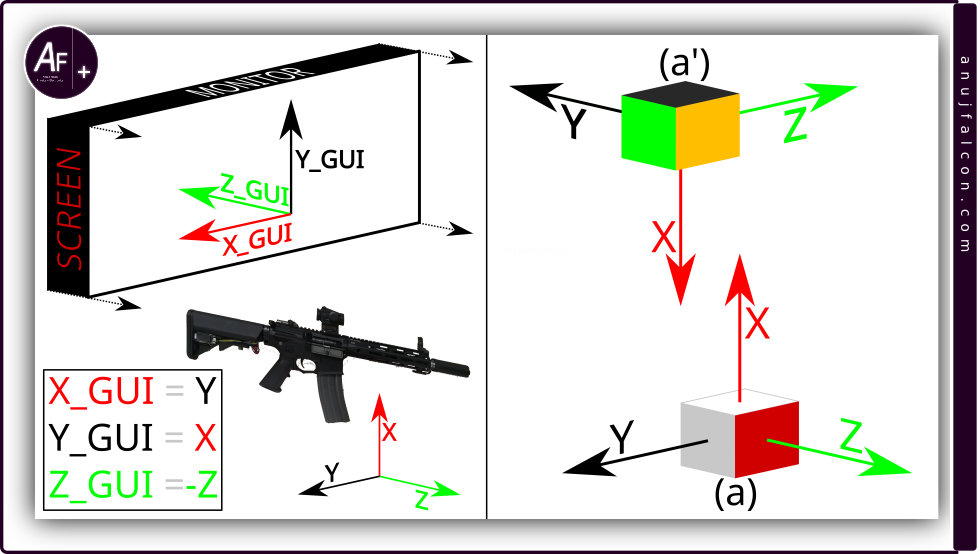
Right handed cartesian coordinate system is also followed by the Processing 4 software that handles the GUI. The exact initial direction of the axes in this coordinate system with respect to the screen displaying the GUI is shown in Figure 24 and Figure 28, marked as X_GUI, Y_GUI and Z_GUI. On the right side of Figure 24, you can see the faces of the 3D cuboid representing the sides of the sensor/AEG and their corresponding axes. It is important to note that the X, Y and Z axes will always remain attached to their corresponding faces of the 3D cuboid, so if the cuboid rotates, the axes also change its direction. This is also true for the sensor as rotating the sensor will change the direction of its axes.
Due to the nature of the soldering done on the GY-521 breakout board containing the MPU-6050 sensor and for convenience reasons, the breakout board was placed inside the crane stock of the AEG in such a way so that the X, Y and Z axes of the sensor do not align with the X_GUI, Y_GUI and Z_GUI axes when the AEG is held in an the up-right position, as shown in Figure 24, with respect to the screen displaying the GUI. This configuration is called configuration 1. The cuboid’s face and the corresponding sensor axes with their direction in this configuration is shown in position (a) and (a’) of Figure 24. The angle traversed by the AEG i.e. the sensor while rotating along an axis is tracked as explained in section ‘Software Description - frontend’. But the rotations of the orientation data i.e. the 3D cuboid displayed by the GUI felt unnatural and disconnected with that of the real world rotations. First I thought it was obviously due to the difference in the axes’ direction. So I corrected it by reversing the sign of angle traversed while rotating along the Z axis and exchanging the values of angle traversed while rotating along X and Y axes with one another before passing it to the orientation data i.e. 3D cuboid. The equations corresponding to this change are highlighted within a box shown at the bottom-left of Figure 24. And, it is important to note that initially the sensor should be positioned such that the direction of its axes coincide with the corresponding initial direction of the GUI axes when the DAQ’s frontend program starts tracking the angle traversed or click the GUI to reset the orientation data once the sensor axes are aligned with the initial GUI axes to get a more natural rotation of the 3D cuboid. With the mathematical modification to the axes interpretation, the initial position in which the sensor should be with respect to the screen displaying the GUI is illustrated in the left part of Figure 24, where X, Y and Z represent the sensor axes. Everything perceived to be working fine for angles less than \(90^\circ\), with the key word being ‘perceived’. When rotating the sensor at or above \(90^\circ\) along different axes, it rotated the 3D cuboid in such a way that it again felt unnatural. So I decided to observe the patterns displayed by the GUI systematically and compare it with the expected patterns for the cuboid. I did this by considering three scenarios.
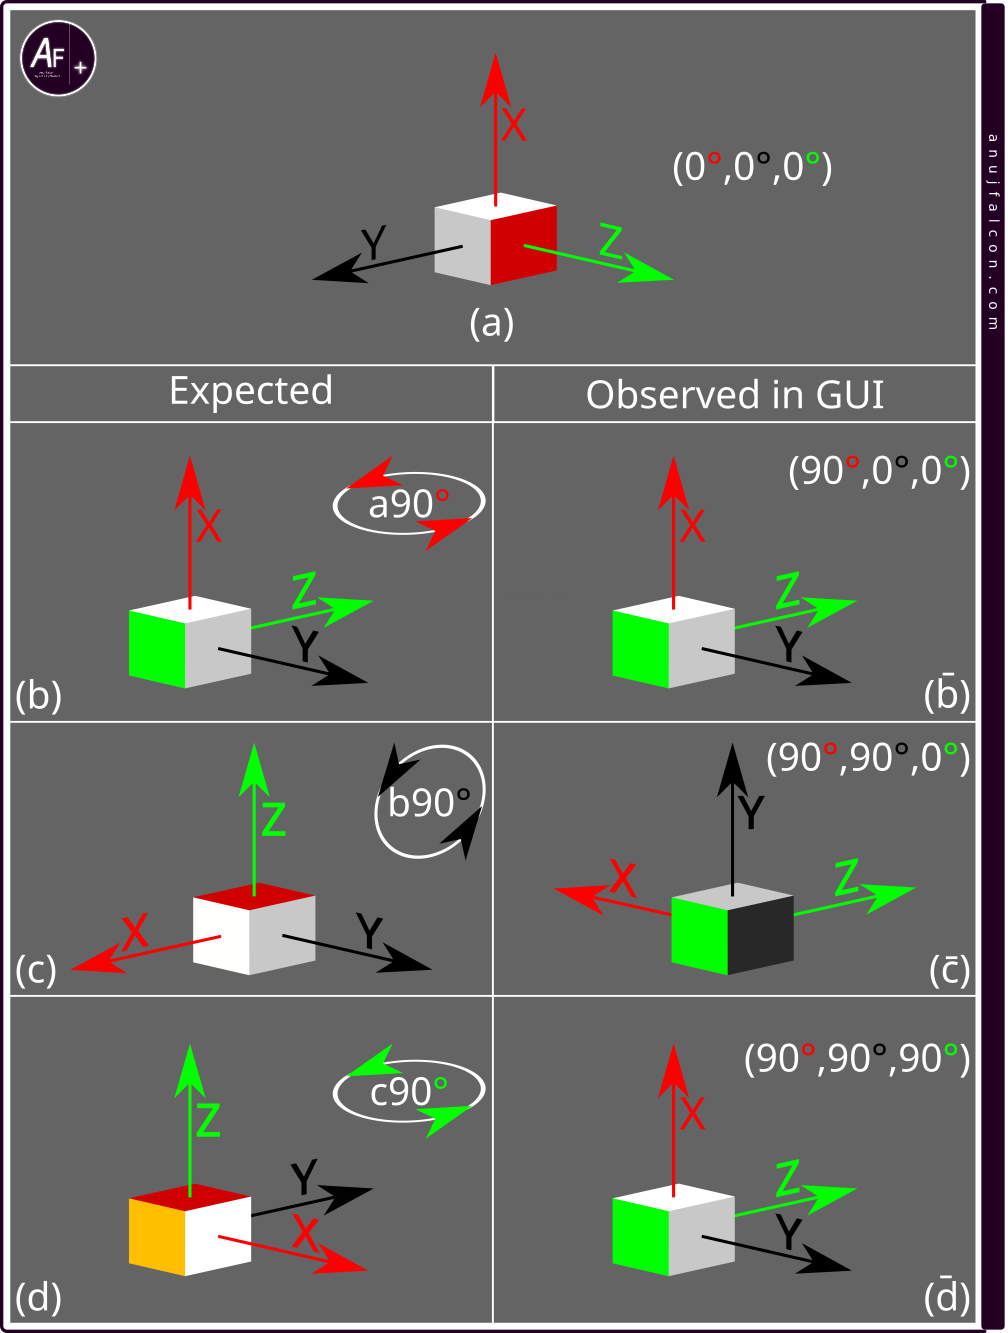
Scenario 1 is rotating the sensor \(90^\circ\) counter clockwise along the X axis of the sensor (facing against X axis’ arrow), then rotating \(90^\circ\) counter clockwise along the Y axis of the sensor (facing against Y axis’ arrow). And finally rotating \(90^\circ\) counter clockwise along the Z axis of the sensor (facing against Z axis’ arrow), which marks the end of scenario 1 \(\left(90^\circ x,90^\circ y ,90^\circ z \right)\). The expected and observed patterns of the orientation data i.e. 3D cuboid for scenario 1 is shown in Figure 25
Let’s consider Figure 25. As you can see, the expected did not always match the observed patterns of the cuboid while following scenario 1. Initially, the cuboid is in position (a). When rotating the cuboid in position (a) \(90^\circ\) counter clockwise along the X axis (facing against X axis’ arrow), it reaches position (b), where both the expected (b) and observed (b̄) positions match. Notice how the Z and Y axes have changed their direction in position (b) when compared to position (a). Rotating the cuboid in (b) \(90^\circ\) counter clockwise along the Y axis (facing against Y axis’ arrow) should result in the 3D cuboid reaching the position (c). But the expected position (c) doesn’t match with the observed position (c̄). Note how the X and Z axes have changed their direction in position (c) when compared to position (b). This coupled with \(90^\circ\) counter clockwise rotation of the cuboid along the Z axis (facing against Z axis’ arrow) should result in position (d). But once again the expected position (d) does not match the observed position (d̄).

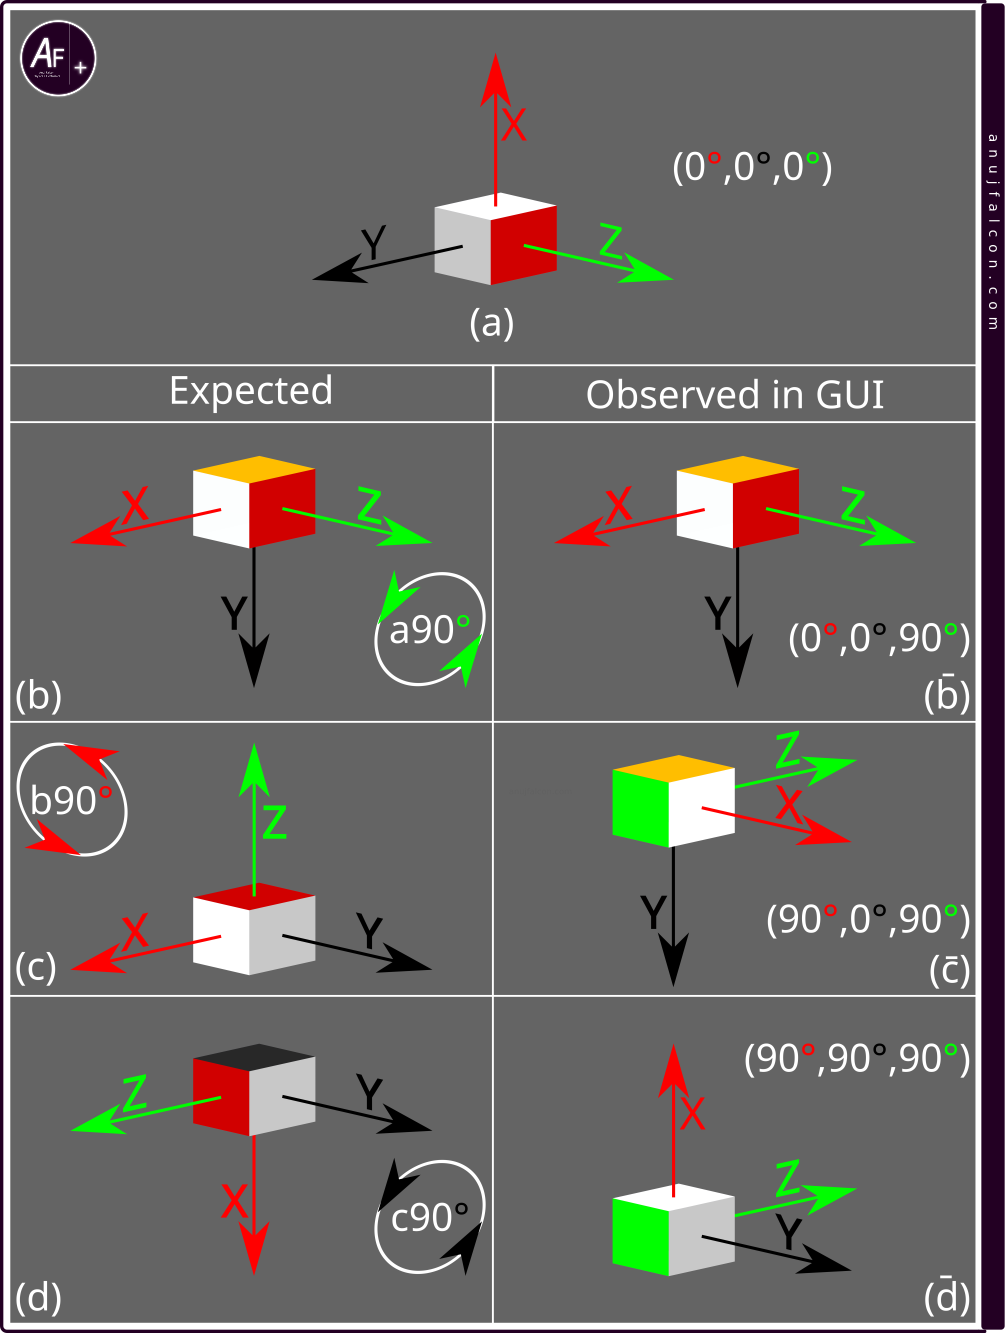
The next scenario is scenario 2 which involves rotating the sensor \(90^\circ\) counter clockwise along the Y axis of the sensor (facing against Y axis’ arrow), then rotating \(90^\circ\) counter clockwise along the X axis of the sensor (facing against X axis’ arrow). And finally rotating \(90^\circ\) counter clockwise along the Z axis of the sensor (facing against Z axis’ arrow), which marks the end of scenario 2 \(\left(90^\circ y,90^\circ x,90^\circ z \right)\). The expected and observed patterns of the orientation data i.e. 3D cuboid for scenario 2 is shown in Figure 26. As you can see, both the expectation and the observation match in all the cases, which is quite unexpected. But it also suggests that some pattern is at play here. So let’s keep digging.
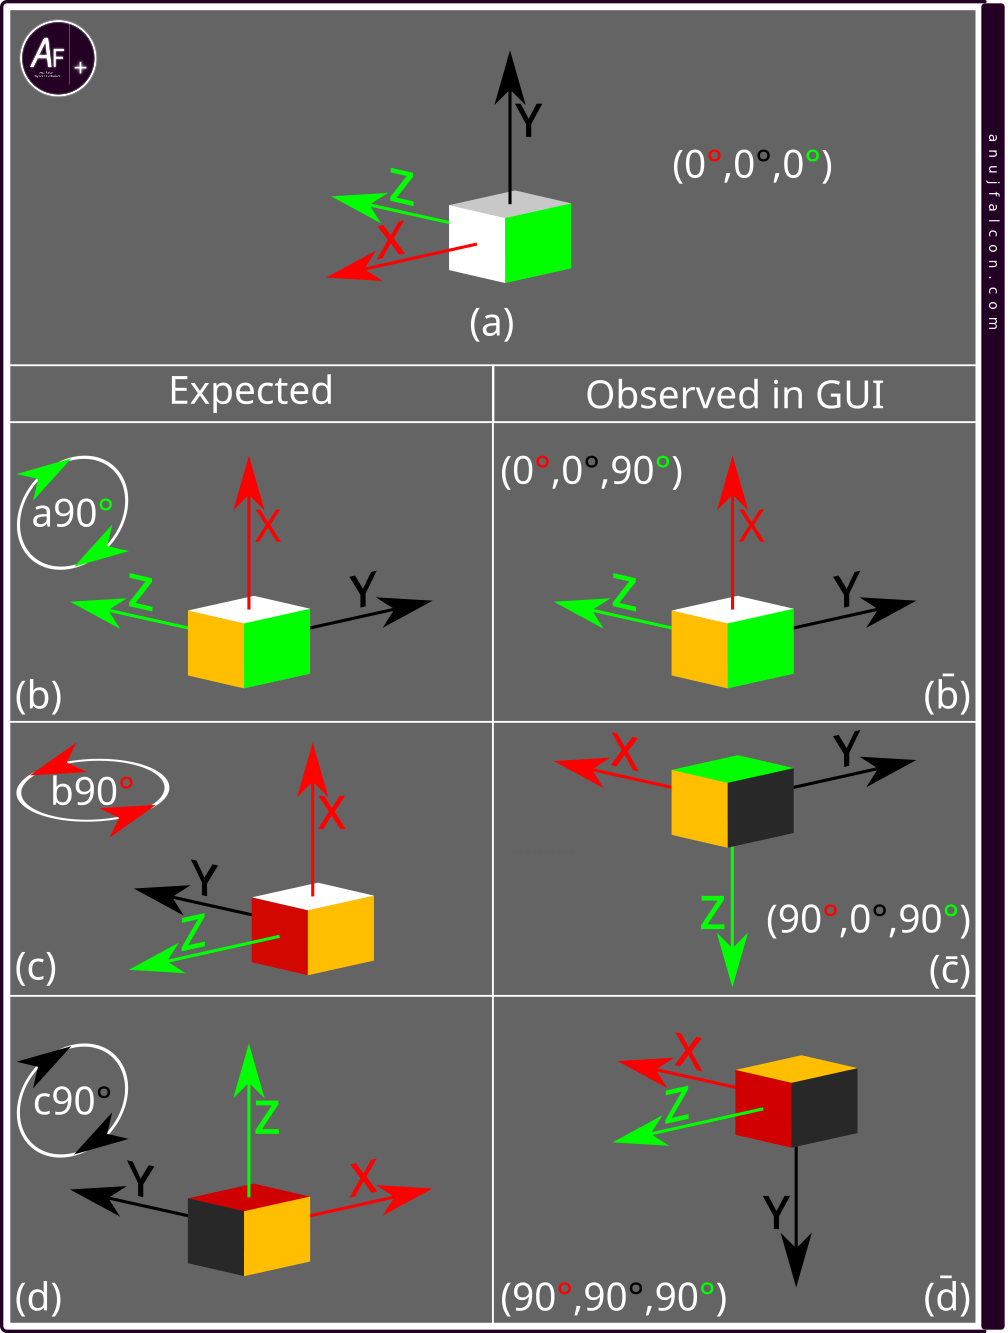
The final scenario is scenario 3 which involves rotating the sensor \(90^\circ\) counter clockwise along the the Z axis of the sensor (facing against Z axis’ arrow), then rotating \(90^\circ\) counter clockwise along the X axis of the sensor (facing against X axis’ arrow). And finally rotating \(90^\circ\) counter clockwise along the Y axis of the sensor (facing against Y axis’ arrow), which marks the end of scenario 3 \(\left(90^\circ z,90^\circ x,90^\circ y \right)\). The expected and observed patterns of the orientation data i.e. 3D cuboid for scenario 3 is shown in Figure 27.
Let’s consider Figure 27. As you can see, the expected did not always match the observed patterns while following scenario 3. Initially, the cuboid is in position (a). When rotating the cuboid in position (a) \(90^\circ\) counter clockwise along the Z axis (facing against Z axis’ arrow), it reaches position (b), where both the expected (b) and observed (b̄) positions match. Notice how the X and Y axes have changed their direction in position (b) when compared to position (a). Rotating the cuboid in position (b) \(90^\circ\) counter clockwise along the X axis (facing against X axis’ arrow) should result in the 3D cuboid reaching the position (c). But the expected position (c) doesn’t match with the observed position (c̄). Note how the Y and Z axes have changed their direction in position (c) when compared to position (b). This coupled with \(90^\circ\) counter clockwise rotation of the cuboid along the Y axis (facing against Y axis’ arrow) should result in position (d). But once again the expected position (d) does not match the observed position (d̄).
I hypothesized that this mismatch between the expected and the observed patterns of the cuboid in the above scenarios is what causes the unnatural rotation of the 3D cuboid in the GUI when the sensor is rotated. I assumed that this could be due to the changes in the interpretation of the angle traversed along an axis, as mentioned in the form of equations within the box located at the bottom-left corner of Figure 24. So I rewrote those equations into what’s shown within the box at the bottom-left of Figure 28, so that the angle traversed along the axes of the sensor are passed directly to the corresponding axes of the orientation data i.e. 3D cuboid in the GUI without modifying it. Let this be configuration 2. The cuboid’s faces and the corresponding direction of the sensor axes in this configuration is shown in position (a) and (a’) of Figure 28.
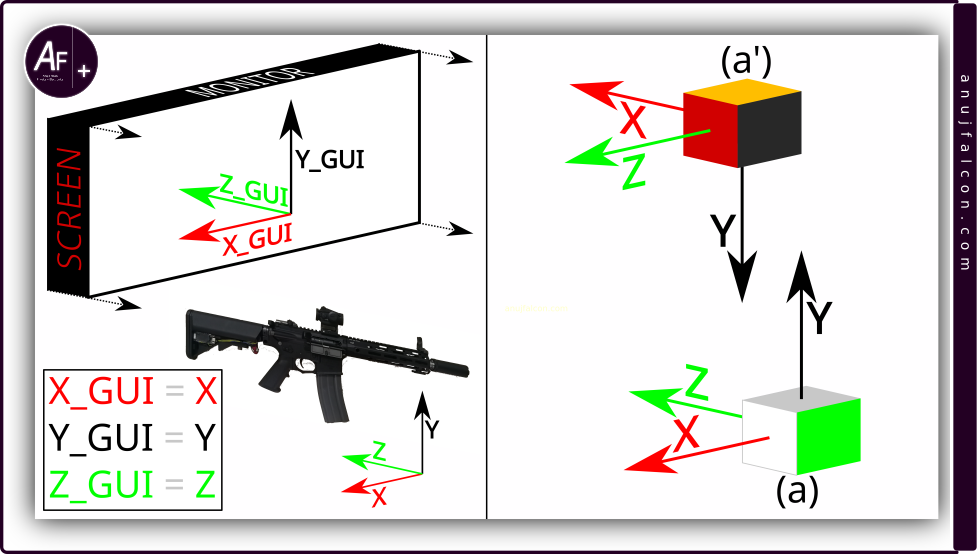
Now I had to initially reposition the sensor such that the X, Y and Z axes of the sensor match with the initial X_GUI, Y_GUI and Z_GUI axes when the DAQ’s frontend program starts tracking the angle traversed or by clicking the GUI to reset the orientation data once the sensor axes are aligned with the initial GUI axes to get a more natural rotation of the 3D cuboid, which is illustrated in the left part of the Figure 28. This would require re-orienting the sensor within the AEG for it to be compatible with the illustration. On the right side of Figure 28, you can see the faces of the 3D cuboid representing the corresponding sides of the sensor/AEG. Using this configuration and the three scenarios same as before, we make a few new observations noted in the consequent paragraphs.

The first scenario is scenario 1 which involves rotating the sensor \(90^\circ\) counter clockwise along the X axis of the sensor (facing against X axis’ arrow), then rotating \(90^\circ\) counter clockwise along the Y axis of the sensor (facing against Y axis’ arrow). And finally rotating \(90^\circ\) counter clockwise along the Z axis of the sensor (facing against Z axis’ arrow), which marks the end of scenario 1 \(\left(90^\circ x,90^\circ y,90^\circ z \right)\). The expected and observed patterns of the orientation data i.e. 3D cuboid for scenario 1 under configuration 2 is shown in Figure 29. As shown, both the expectation and the observation match in all the cases, which is interesting.
Let’s consider Figure 30. As you can see, the expected did not match the observed patterns in all the cases while following scenario 2 \(\left(90^\circ y,90^\circ x,90^\circ z \right)\). Initially, the cuboid is in position (a). When rotating the cuboid in position (a) \(90^\circ\) counter clockwise along the Y axis (facing against Y axis’ arrow), it reaches position (b), where both the expected (b) and observed (b̄) positions match. Notice how the X and Z axes have changed their direction in position (b) when compared to position (a). Rotating the cuboid in (b) \(90^\circ\) counter clockwise along the X axis (facing against X axis’ arrow) should result in the 3D cuboid reaching the position (c). But the expected position (c) doesn’t match with the observed position (c̄). Note how the Y and Z axes have changed their direction in position (c) when compared to position (b). This coupled with \(90^\circ\) counter clockwise rotation of the cuboid along the Z axis (facing against Z axis’ arrow) should result in position (d). But once again the expected position (d) does not match the observed position (d̄).
Now let’s consider Figure 31. Again, the expected did not match the observed patterns in all the cases while following scenario 3 \(\left(90^\circ z,90^\circ x,90^\circ y \right)\). Initially, the cuboid is in position (a). When rotating the cuboid in position (a) \(90^\circ\) counter clockwise along the Z axis (facing against Z axis’ arrow), it reaches position (b), where both the expected (b) and observed (b̄) positions match. Notice how the X and Y axes have changed their direction in position (b) when compared to position (a). Rotating the cuboid in position (b) \(90^\circ\) counter clockwise along the X axis (facing against X axis’ arrow) should result in the 3D cuboid reaching the position (c). But the expected position (c) does not match with the observed position (c̄). Note how the Y and Z axes have changed their direction in position (c) when compared to position (b). This coupled with \(90^\circ\) counter clockwise rotation of the cuboid along the Y axis (facing against Y axis’ arrow) should result in position (d). But once again the expected position (d) does not match the observed position (d̄).
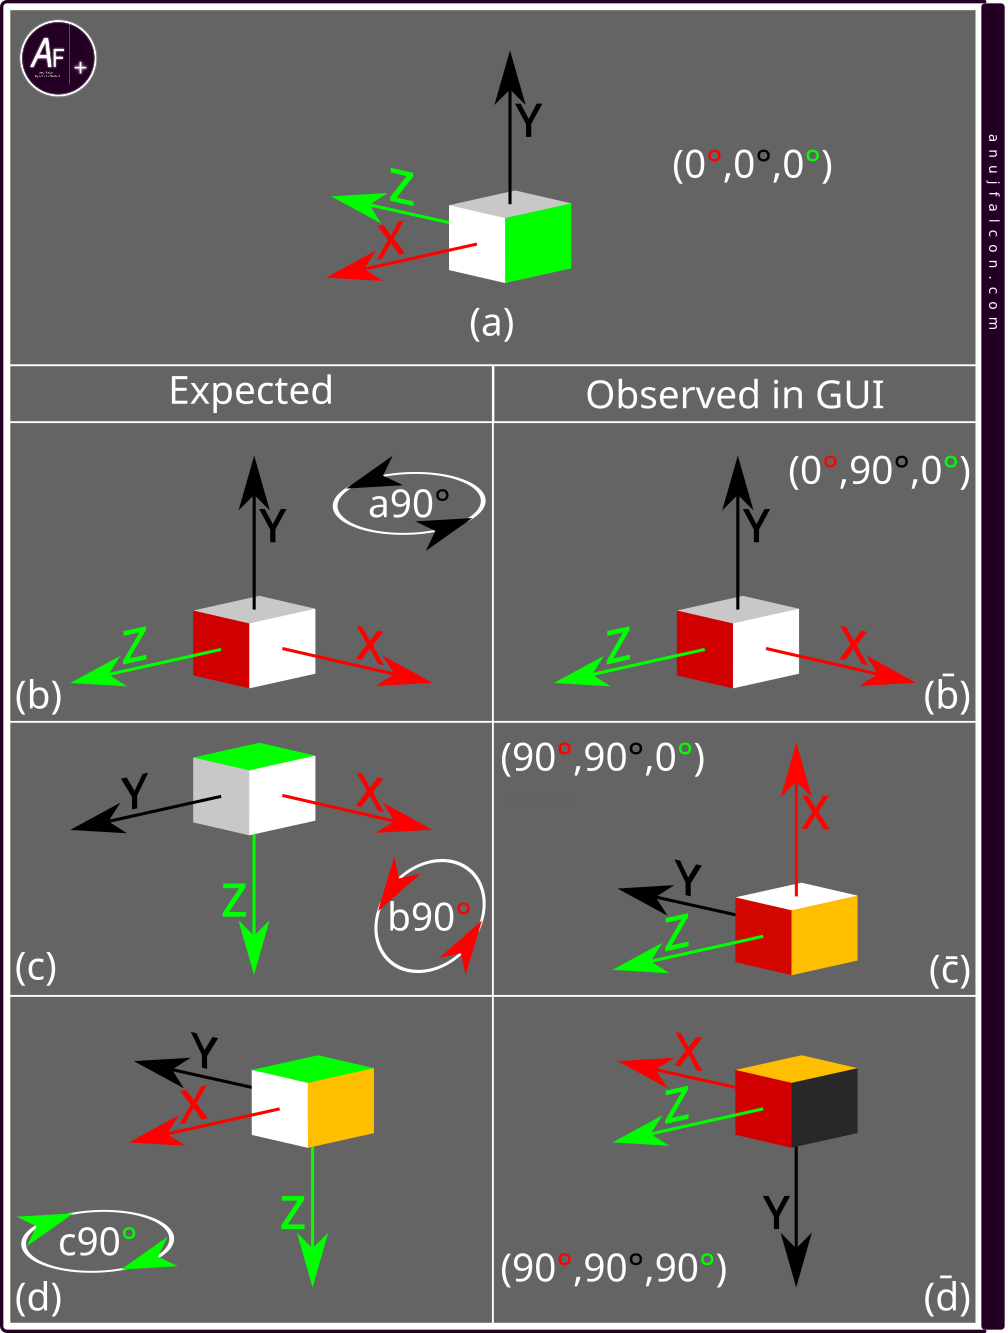
As it can be seen, the patterns expected from the 3D cuboid under different scenarios did not match with the expectation even in configuration 2, which made the rotation of the 3D cuboid feel unnatural and disconnected from reality. So I began looking for the source of this unnaturalness elsewhere. There are other sources that I could think of, which could give rise to this unnaturalness. One source is somewhere within the way the angle of traversal is calculated by the Riemann sum i.e. within all the process before the final angle values is calculated, including the interpretation of the data from the gyroscope of the sensor and another source is the way the angle of traversal is interpreted by the GUI for drawing the 3D cuboid. The first source was found to be not the cause of this unnaturalness as it was manually observed that the expected angle of traversal value matched with the observed value for all the scenarios. Hence I started looking for signs of unnaturalness due to the later source by analyzing the results from the two configurations, which contains three scenarios per configuration and that makes a total of six results shown in Figure 25, Figure 26, Figure 27, Figure 29, Figure 30 and Figure 31. The angle value expected to be traversed along the X, Y and Z axes are also noted in those figures as a triplet within the parentheses for each of the expected and observed pairs.
- It can be seen that in all the results, the expected and observed pair corresponding to position (b) and (b̄) always seem to match. This can be attributed to being just rotated only once along either X, Y or Z axis when compared to the starting position (a), hence they have only one non-zero value in their corresponding triplet containing the angle traversed
- The position (d) corresponding to the expected pattern for all the scenarios within a given configuration are different and do not match with one another. However, the position (d̄) for all the observed patterns of the 3D cuboid within a given configuration always seem to match. That’s interesting
- Also, it is equally interesting to note that one scenario per configuration seem to have both expected and the observed patterns match for all the cases (Scenario 2 for configuration 1 and scenario 1 for configuration 2)
Upon pondering on this issue further, I realized that the scenario 2 in configuration 1 has \(90^\circ\) along the Y axis, \(90^\circ\) along the X axis and \(90^\circ\) along the Z axis of the sensor as the order of the angle traversed. Considering the modifications done to these values using the equation in Figure 24, it corresponds to \(90^\circ\) along the X_GUI axis, \(90^\circ\) along the Y_GUI axis and 90 along the Z_GUI axis of the 3D cuboid as the exact order of the angle traversed for the cuboid in the GUI. The similar case is also true for scenario 1 in configuration 2.
So whenever the order of the angle traversed by a sensor in a particular scenario results in the order of the angle traversed by the 3D cuboid being \(90^\circ\) along the X_GUI axis, \(90^\circ\) along the Y_GUI axis and \(90^\circ\) along the Z_GUI axis, the expected pattern of the 3D cuboid matches with the observation. Coupling this with the fact that all the observed positions (d̄) for different scenarios under a given configuration seems to be the same made me think that it could be the case where the 3D cuboid is rotated in the GUI based on a single triplet value at any given moment, independent of the previous triplet values.
I initially thought that the axes of the GUI i.e. X_GUI, Y_GUI and Z_GUI do not change their direction after any rotation. But this was found to be not true as described in the following sentences. Even though the rotation of the 3D cuboid is dependent only on one (latest) triplet value and not on the previous triplet values, a single triplet value by itself changes the direction of the axes of the GUI. The DAQ’s frontend program responsible for drawing the 3D cuboid using the Processing 4’s libraries first takes into account the first value of the triplet, which is the angle traversed along the X axis of the sensor and rotates the 3D cuboid along the X_GUI axis. This also changes the direction of the Y_GUI and Z_GUI axes. Next it takes into account the second value in the triplet i.e. angle traversed along the Y axis of the sensor and uses this value to rotate the 3D cuboid along the changed Y_GUI axis. This changes the direction of X_GUI and Z_GUI axes. Finally the third value of the triplet i.e. the angle traversed along the Z axis of the sensor is taken into account and the 3D cuboid is rotated along the twice changed Z_GUI axis. This order of execution for rotating the 3D cuboid does not change while calculating the position of the 3D cuboid i.e. the angle traversed along the X axis is taken first, then the Y axis and the Z axis. This kinda explains the match in all the positions of the 3D cuboid between the observed and expected pairs in Figure 26 corresponding to scenario 2 of configuration 1 and Figure 29 corresponding to scenario 1 of configuration 2.
This means the actual order of the angular traversals based on the previous triplet values are currently not taken into account and have zero effect on the rotation of the 3D cuboid as it does not change the direction of the GUI axes. But it should, as it does for the sensor, to feel the 3D cuboid rotate more naturally. So it does not matter if the sensor is rotated \(90^\circ\) along the X axis first and then \(90^\circ\) along the Y axis second or vice versa, as both will result in the same position of the 3D cuboid in the GUI (but not for the sensor), which is also proven by the fact that the observed position (c̄) being the same in scenarios 1 and 2, within a given configuration. But it’s not the case with the sensor, which is pretty interesting to observe by directly holding the sensor in hand and trying to do the above rotations in the corresponding order.
Based on these observations made so far, I guess 4 things should be considered for the 3D cuboid to look natural while rotating:
-
The order of rotation matters i.e. take into account the change in direction of the sensor’s axes due to previous angle of traversals (previous triplet values) before applying the successive angle of traversals (later triplet values).
-
Initial synchronization in the direction of the sensor axes with the axes of the GUI displayed on the screen is required, before starting to track the angle
-
Either eliminating the aberration in time period or taking into account the aberrations i.e. change in time period for calculating the Riemann sum is required to reduce phantom rotations
-
Reducing noise in the sensor measurements to reduce its effects such as phantom rotations
Network concerns
Finally, When I followed the steps mentioned in the next section titled “Steps to recreate the project”, I could not get things to work. The GUI of the DAQ’s frontend did not display the data that was supposed to be collected by DAQ’s backend. Upon further debugging, I realized that the DAQ’s backend connects to the WiFi which belongs to the same network as the PC, but it does not seem to establish the TCP socket connection with the DAQs frontend. This was later found out to be due to the improper setup of the network. For easy management purposes, I created a second SSID with network isolation protection, especially for connecting wirelessly and experimenting with embedded devices. Hence, the devices connected to this SSID were isolated from the rest of the network by default. As the desktop PC was connected through ethernet and the Laptop PC was connected through the first SSID, the router did not allow them to communicate with the devices connected to the second SSID i.e. ESP32 development board. This issue was resolved by disabling the network isolation protection within the router for the second SSID. When working with mobile WiFi hotspot (instead of router), few manual WiFi connection retries might be required, especially when hotspot is only used for LAN purposes and not as a gateway for the internet (mobile data turned off).
Steps to recreate the project
The project was developed and tested with a personal desktop computer (PC) running Kubuntu, which is a Linux based operating system and a personal laptop computer (PC) running Windows 10 operating system. Both have processors manufactured from Intel and have 16 GB of memory. In order to key-in and manage the code, two programmes namely Visual studio code and git were used. In order to compile the code and upload the executable into the ESP32 development board, ESP-IDF version 4.4 was used. The ESP-IDF programming guide [4] has information on how to install the framework on both the operating systems and how to get started. A USB type A male to USB type C male connector cable was also used to connect the PC to the ESP32 development board.
Before proceeding with the hardware design based on the ‘Hardware description’ section, please test the components functionality individually. The type of buck converter used for this project is a pre-assembled version with rotary potentiometer to configure the output voltage. Caution must be exercised while connecting the ESP32 development board to the buck converter as it is required to configure the output voltage of the buck converter before connecting it to the ESP32 development board inorder to avoid damaging the development board. Be careful while connecting the battery, as short circuits in those connections are a significant fire hazard.
Table 2: List of hardware components used in the project’s electrical system
| Component name | Reference | Description | |
|---|---|---|---|
| AEG controller | C1 | The electronic controller used by AEG (colloquial called the ‘MOSFET’ ) | |
| Fuse | F1 | Used by AEG controller for circuit overcurrent protection | |
| JST ZH connectors | J1, J2 and J3 | JST type connectors comprising of male and female components with 1.5 mm pitch | |
| Deans/T plug | J4 | Deans/T plug to connect battery to the AEG controller | |
| Sliding connector | J5 | Sliding connector to power the motor | |
| JST connector | Female J6 | JST female connector with 2.0 mm pitch | |
| Dupont connectors | Male J6 | Used by the buck converter to connect to the battery | |
| DC Motor | M1 | Used by the AEG for mechanically powering the gearbox | |
| Buck converter | P1 | Voltage step-down device for powering DAQ’s backend from the battery directly | |
| GY-521 breakout board | S1 | Contains the MPU-6050 6DoF measuring sensor for the DAQ’s backend. Communicates using I2C protocol | |
| Battery | BT1 | Lithium Ion battery in 3S configuration rated 33.3 Wh | |
| ESP32 dev board | DB1 | ESP32 development board from Lilygo | |
| Joulescope | ME1 | Used for continuous voltage and current measurement in a circuit, thus indirectly measures power and joule | |
| Momentary switch | SW1 | A SPST limit switch for controlling the trigger signal | |
| Momentary switch | SW2 | A SPST limit switch for detecting the emptiness of the AEG’s magazine by controlling the trigger signal | |
| Momentary switch | SW3 | A SPST limit switch for indicating the gearbox cycle status | |
| Momentary switch | SW4 | A SPST limit switch for indicating the selector (firing mode) position |
The components used in the schematic diagram shown in Figure 9, Figure 15 and Figure 18 are tabulated in Table 2. One might also require an AEG similar to the one used in this article to attach the DAQ system. If you are interested in monitoring and measuring the electrical signals, a Joulescope or other type of oscilloscope with shunt resistor setup can be helpful. When making crimped connections, it is recommended to test the connection for electrical and mechanical performance. I carry out the electrical performance test by measuring the resistance of the connection using a multimeter after the mechanical performance test, which is manually done by simply trying to pull (gently) the wire from the crimped connector with my fingers, during which the crimped connector is expected to stay in place.
DAQ’s frontend can be set up in the PC by installing the Processing 4 software (tested version 4.0.1) and connecting the PC to the local network, to which the DAQ’s backend can be connected wirelessly. I used a Nokia G-2425G-A router for this purpose. It is recommended to assign a static IP address to the PC as it is required by the code used for programming the ESP32 development board. Nonetheless, I was also able to get it working with the WiFi hotspot of Honor 8 Pro mobile device, where the PC and the DAQ’s backend were connected to it wirelessly. Default PORT number used by the DAQ’s frontend is ‘1531’. Both the Linux and Windows based systems can run the DAQ’s frontend using the open sourced code, which is openly available from the public gitlab repository with the URL: ‘https://gitlab.com/ajblogs/aeg-daq-incomplete’ by following the steps below:
- Install the git software and make sure its added to the path
- Install the Processing 4 software
- Open the command terminal/PowerShell
- Enter the directory of your choice for downloading the code. Let this be DOWNLOAD_DIR
- Enter the command: git clone https://gitlab.com/ajblogs/aeg-daq-incomplete
- Open the Processing 4 GUI (with administrative privileges if required)
- Navigate to File -> Open
- Open the DOWNLOAD_DIR/aeg-daq-incomplete/daq_frontend/DAQ_frontend.pde file
- If required, edit the PORT number used by the TCP server in this file. Default value is ‘1531’
- Click the ‘RUN’ button on the GUI
Once the DAQ’s front end server is running and it’s PORT number and IP address are obtained along with information such as the wireless network’s SSID and password, it is ready to be connected to the DAQ’s backend. Once the DAQ’s backend hardware is ready and the ESP-IDF is installed in the PC, it is possible to use the open sourced code provided for the DAQ’s backend [20] by following the steps below.
For Linux OS based systems:- Open the command terminal
- Enter the command: ls /dev | grep “ttyACM|ttyUSB”
- Note the list of USB serial devices displayed (might return nothing if no USB serial device is connected)
- Connect the ESP32 development board to the PC using the USB cable
- Enter the command: ls /dev | grep “ttyACM|ttyUSB”
- Compare the list displayed with the previous list to find the name of the port assigned to the connected ESP32 development board. For example, it could be something like ‘ttyACM0’ and the complete path to the device would then be ‘/dev/ttyACM0’. Let’s call this complete path as PORTNAME.
- Enter the directory of your choice for downloading the code
- Enter the command: git clone https://gitlab.com/ajblogs/aeg-daq-incomplete
- Enter the command: nano aeg-daq-incomplete/daq_backend/main/common.h
- Edit the text to define the wireless network’s SSID with the WIFI_SSID macro
- Edit the text to define the wireless network’s password with the WIFI_PSWD macro
- Edit the text to define the IP address of the PC running the frontend of the DAQ with the COMMS_DATA_SERVER_IP macro
- Edit the text to define the PORT number of the TCP server used by the DAQ’s frontend with the COMMS_DATA_SERVER_PORT macro. Default value is ‘1531’.
- Enter ‘ctrl+o’, ‘enter’, and ‘ctrl+x’
- Enter the command: cd aeg-daq-incomplete/daq_backend
- Enter the commands required to export the tools by the ESP-IDF (which is obtained during installation). I usually assign an alias named ‘idfpy’ defined in the ‘.bashrc’ file, which is later used to add the ESP-IDF tools to the path in the command terminal by invoking the alias
- Enter the command: idf.py build
- If an error occurred in the execution of the previous command, it implies the compilation has failed and requires addressing the issues mentioned in the error message. Else, proceed to the next step.
- Enter the command: idf.py -p PORTNAME flash
- Upon successful execution of the previous commands, disconnect the USB cable. If the previous command failed, it means there was some error while trying to program (uploading the code) the ESP32 development board. It might be the case where the PC requires the user to provide the necessary permission to access the USB device
- Open the PowerShell titled ESP-IDF 4.4, which is created during installation of the ESP-IDF version 4.4 in Windows OS
- Open the device manager and note the USB devices connected
- Connect the ESP32 development board to the PC using the USB cable
- Check the device manager again to notice the change in the USB device connected and note the port name. It could be something like ‘COM4’. Let this be the PORTNAME
- Enter the directory of your choice for downloading the code
- Enter the command: git clone https://gitlab.com/ajblogs/aeg-daq-incomplete
- Enter the command: notepad.exe .\aeg-daq-incomplete\daq_backend\main\common.h
- Edit the text to define the wireless network’s SSID with the WIFI_SSID macro
- Edit the text to define the wireless network’s password with the WIFI_PSWD macro
- Edit the text to define the IP address of the PC running the frontend of the DAQ with the COMMS_DATA_SERVER_IP macro
- Edit the text to define the PORT number of the TCP server used by the DAQ’s frontend with the COMMS_DATA_SERVER_PORT macro. Default value is 1531.
- Enter ‘ctrl+s’ and ‘alt+F4’
- Enter the command: cd .\aeg-daq-incomplete\daq_backend
- Enter the command: idf.py build
- If an error occurred in execution of the previous command, it implies that the compilation has failed and requires addressing the issues mentioned in the error message. Else, proceed to the next step.
- Enter the command: idf.py -p PORTNAME flash
- Upon successful execution of the previous commands, disconnect the USB cable. If the previous command failed, it implies there was some error while trying to program (uploading the code) the ESP32 development board. It might be the case where the PC requires the user to relaunch the PowerShell with administrator privileges
Once the ESP32 device is programmed, it can act as a portable backend for the DAQ and can transmit the data to the DAQ’s front end. Make sure that the router is on. Connect the DAQ’s backend to the battery (BT1) if it’s not already connected and make sure the connections are in accordance with the schematic diagram provided in Figure 9. But also take into account all the design flaws and observations detailed in the section ‘Observation and discussion’, especially the subsection ‘Hardware design caveats’. Run the DAQ’s frontend program. Assuming the network is set-up properly, the DAQ’s frontend will start receiving the data. Once the DAQ’s frontend starts receiving the data, its GUI will change alike to the ones shown in Figure 11 and Figure 12.
Acknowledgement
I would like to thank my sister, Linza Justus, who is in the second year of her B.A. English course at Stella Maris College, Chennai, for her comments, which helped me improve the language and style of this article.
References
- https://www.guay2.com/en/product/detail-1885
- https://www.youtube.com/watch?v=nu2FK5MZCpA
- https://titanbatteries.eu/collections/nunchuck/products/3000mah-11-1v-nunchuck-t-plug-deans
- https://docs.espressif.com/projects/esp-idf/en/latest/esp32/
- https://www.analog.com/media/en/technical-documentation/application-notes/54305147357414AN686_0.pdf
- https://invensense.tdk.com/wp-content/uploads/2015/02/MPU-6000-Datasheet1.pdf
- https://invensense.tdk.com/wp-content/uploads/2015/02/MPU-6000-Register-Map1.pdf
- https://github.com/Xinyuan-LilyGO/TTGO-T-Display
- http://www.lilygo.cn/prod_view.aspx?Id=1126)
- https://espressif.com/sites/default/files/documentation/esp32_datasheet_en.pdf
- https://espressif.com/sites/default/files/documentation/esp32_technical_reference_manual_en.pdf
- https://processing.org/download
- https://www.uvex-safety.com.my/en/products/tactical/7067/uvex-apache-spec/
- https://www.joulescope.com/
- https://www.joulescope.com/pages/downloads
- https://github.com/OpenHantek/OpenHantek6022
- https://www.khanacademy.org/math/ap-calculus-ab/ab-integration-new/ab-6-2/a/left-and-right-riemann-sums
- https://www.sfu.ca/math-coursenotes/Math%20158%20Course%20Notes/sec_riemann.html
- https://www.physicsclassroom.com/Class/vectors/U3L1b.cfm
- https://gitlab.com/ajblogs/aeg-daq-incomplete
- https://www.acetk.com/products/lighter-bt